Stock Status and Conservation Information
(From ISC17 Plenary Report)
North Pacific Albacore
Stock Status
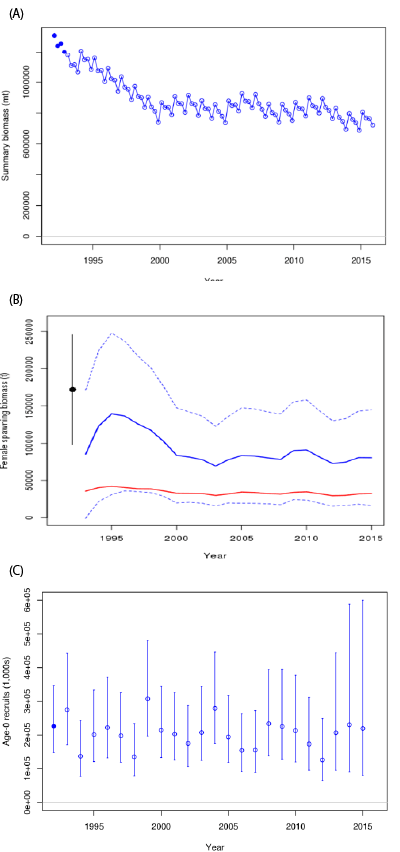
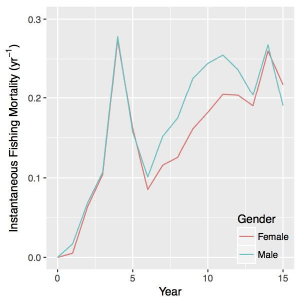
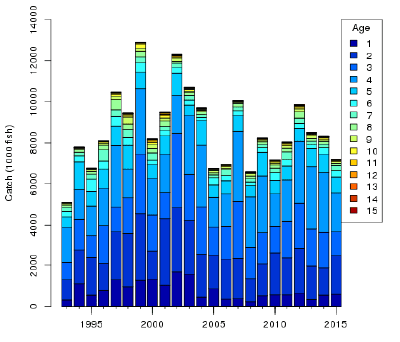
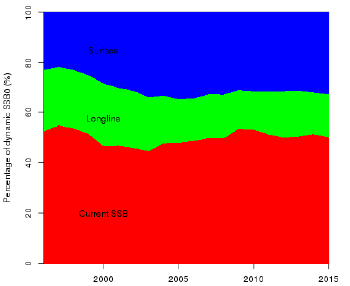
Estimated total stock biomass (males and female at age-1+) declines at the beginning of the time series until 2000, after which biomass becomes relatively stable (Figure 1A). Estimated female SSB exhibits a similar population trend, with an initial decline until 2003 followed by fluctuations without a clear trend through 2015 (Figure 1B). The estimated SPR (spawners per recruit relative to the unfished population) in 2015 is 0.53, which corresponds to a moderate fishing intensity (i.e., 1-SPR = 0.47). Instantaneous fishing mortality at age (F-at-age) is similar in both sexes through age-5, peaking at age-4 and declining to a low at age-6, after which males experience higher F-at-age than females up to age 13 (Figure 2). Juvenile albacore aged 2 to 4 years comprised, on average, 70% of the annual catch between 1993 and 2015 (Figure 3) as reflected by the larger impact of the surface fisheries (primarily troll, pole-and-line) which remove juvenile fish, relative to longline fisheries, which primarily remove adult fish (Figure 4).
The WCPFC adopted a limit reference point (LRP) for the spawning stock biomass of 20% of the spawning stock biomass when F=0 (20%SSBcurrent, F=0) (https://www.wcpfc.int/harvest-strategy). The 20%SSBcurrent, F=0 LRP is based on dynamic biomass and fluctuates depending on changes in recruitment. However, there are no adopted F-based limit reference points.
Stock status is depicted in relation to the limit reference point (LRP; 20%SSBcurrent, F=0) for the stock and the equivalent fishing intensity (F20%; calculated as 1-SPR20%) (Figure 5A). Fishing intensity (F, calculated as 1-SPR) is a measure of fishing mortality expressed as the decline in the proportion of the spawning biomass produced by each recruit relative to the unfished state.
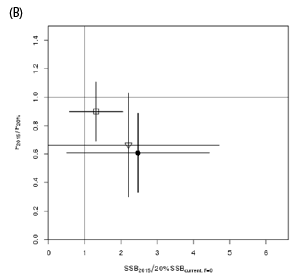
The Kobe plot shows that the estimated female SSB has never fallen below the LRP since 1993, albeit with large uncertainty in the terminal year (2015) estimates (Figure 5A). Even when alternative hypotheses about key model uncertainties such as natural mortality and growth were evaluated, the point estimate of female SSB in 2015 (SSB2015) did not fall below the LRP, although the risk increases with these more extreme assumptions (Figure 5B). The SSB2015 was estimated to be 80,618 t and was 2.47 times greater than the LRP threshold of 32,614 t (Table 1). Current fishing intensity, F2012-2014 (calculated as 1- SPR2012-2014), was lower than potential F-based reference points identified for the north Pacific albacore stock, except F50% (calculated as 1-SPR50%) (Table 1).
Based on these findings, the following information on the status of the north Pacific albacore stock is provided:
- The stock is likely not overfished relative to the limit reference point adopted by the Western and Central Pacific Fisheries Commission (20%SSB current F=0), and
- No F-based reference points have been adopted to evaluate overfishing. Stock status was evaluated against seven potential reference points. Current fishing intensity (F2012-2014) is below six of the seven potential reference points (see ratios in Table 1), except F50%.
| Quantity | Base Case | M = 0.3 y-1 | Growth CV = 0.06 for Linf |
|---|---|---|---|
| MSY(t)A | 132,072 | 92,027 | 118,836 |
| SSBMSY (t)B | 24,770 | 42,098 | 22,351 |
| SSB0 (t)B | 171,869 | 270,879 | 156,336 |
| SSB2015 (t)B | 80,618 | 68,169 | 63,719 |
| SSB2015/20%SSBcurrent, F=0B | 2.47 | 1.31 | 2.15 |
| F2012-2014 | 0.51 | 0.74 | 0.57 |
| F2012-2014/FMSY | 0.61 | 0.89 | 0.68 |
| F2012-2014/F0.1 | 0.58 | 0.90 | 0.65 |
| F2012-2014/F10% | 0.56 | 0.81 | 0.63 |
| F2012-2014/F20% | 0.63 | 0.91 | 0.71 |
| F2012-2014/F30% | 0.72 | 1.04 | 0.81 |
| F2012-2014/F40% | 0.85 | 1.21 | 0.96 |
| F2012-2014/F50% | 1.01 | 1.47 | 1.16 |
- MSY includes male and female juvenile and adult fish
- Spawning stock biomass (SSB) in this assessment refers to mature female biomass only.
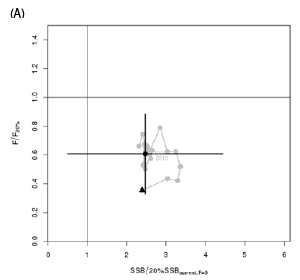
- Kobe plot showing the status of the north Pacific albacore (Thunnus alalunga) stock relative to the 20%SSBcurrent, F=0 biomass-based limit reference point (WCPFC), and equivalent fishing intensity (F20%; calculated as 1-SPR20%) over the base case modeling period (1993-2015). Note that no F-based reference point is established for north Pacific albacore by either the IATTC or WCPFC. F20% was chosen for this plot as a convenient analogue to the limit reference point but it should not be inferred that it represents advice on the choice of an F-based reference point on this stock. Black triangle indicates the start year (1993) and black circle with 95% confidence intervals indicates the terminal year (2015).
- Kobe plot showing stock status and 95% confidence intervals in the terminal year (2015) of the base case model (black; closed circle) and important sensitivity runs with M = 0.3 y-1 for both sexes (pen square), and CV = 0.06 for Linf in the growth model (white; open triangle). Fs in this figure are not based on instantaneous fishing mortality. Instead, the Fs are indicators of fishing intensity based on SPR and calculated as 1-SPR so that the Fs reflects changes in fishing mortality. SPR is the equilibrium SSB per recruit that would result from the current year’s pattern and intensity of fishing mortality.
Conservation Information
Two harvest scenarios were projected to evaluate impacts on future female SSB: F at the 2012-2014 rate over 10 years (F2012-2014) and 1 (average of 2010-2014 = 82,432 t) over 10 years. 2 (Figure 6). In contrast, employing the constant catch harvest scenario is expected to reduce female SSB to 47,591 t (95% CI: 5,223 - 89,958 t) by 2025 and increases the probability that female SSB will be below the LRP to about 3.5 and 30 % in 2020 and 2025, respectively (Figure 7). In addition, as biomass declines during the projection period the fishing intensity approximately doubles by 2025. The probabilities of declining below the LRP in both harvest scenarios are likely higher in the future because projection results did not capture the full envelope of uncertainty. . The ALBWG notes that the lack of sex-specific size data, uncertainty in growth and natural mortality, and the simplified treatment of the spatial structure of north Pacific albacore population dynamics are important sources of uncertainty in the assessment.
Based on these findings, the following information is provided:
- If a constant fishing intensity (F2012-2014) is applied to the stock, then median female spawning biomass is expected to undergo a moderate decline, with a < 0.01% probability of falling below the limit reference point established by the WCPFC by 2025. However, 1
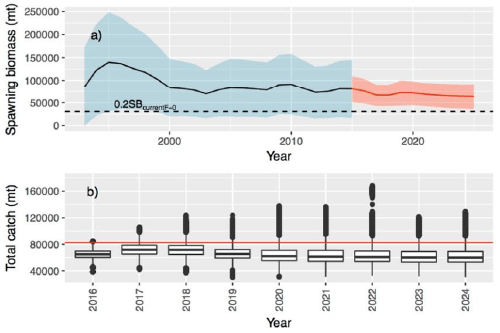
- If a constant average catch (C2010-2014 = 82,432 t) is removed from the stock in the future, then the decline in median female spawning biomass will be greater than in the constant F intensity scenario and the probability that SSB falls below the LRP will be greater by 2025 (30%). Additionally, the estimated fishing intensity will double relative to the current level (F2012-2014) by 2025 as spawning biomass declines.
- Historical and future trajectory of north Pacific albacore (Thunnus alalunga) female spawning biomass (SSB) under a constant fishing intensity (F2012-2014) harvest scenario. Future recruitment was based on the expected recruitment variability and autocorrelation. Black line and blue area indicates maximum likelihood estimates and 95% confidence intervals (CI), respectively, of historical female SSB, which includes parameter uncertainty. Red line and red area indicates mean value and 95% CI of projected female SSB, which only includes future recruitment variability and SSB uncertainty in the terminal year.
- Expected annual catch under a constant fishing intensity (F2012-2014) harvest scenario (2016-2025). The red line is the current average catch (2010-2014 = 82,432 t).
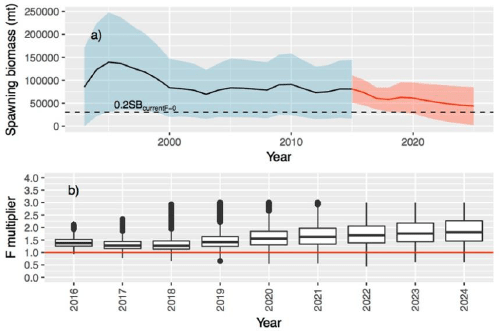
- Historical and future trajectory of north Pacific albacore (Thunnus alalunga) female spawning biomass (SSB) under a constant catch (average 2010-2014 = 82,432 t) harvest scenario. Future recruitment was based on the expected recruitment variability and autocorrelation. Dashed line indictaes the average limit reference point threshold for 2012-2014. Black line and blue area indicates maximum likelihood estimates and 95% confidence intervals (CI), respectively, of historical female SSB, which includes parameter uncertainty. Red line and red area indicates mean value and 95% CI of projected female SSB, which only includes future recruitment variability and SSB uncertainty in the terminal year.
- Projected fishing intensity relative to the current fishing inetnsity (2012-2014) (red line) under a constant catch scenario (average 2010-2014).