Stock Status and Conservation Information
(From ISC17 Plenary Report)
North Pacific Blue shark
Stock Status
The assessment uses a fully integrated, sex-specific Stock Synthesis (SS) model. Model inputs have been greatly improved since the previous assessment. The main differences between the present assessment and the 2014 assessment are:
- use of SS with a thorough examination of the size composition data, and the relative weighting of CPUE and composition data
- improved life history information, such as growth and reproductive biology, and their contribution to productivity assumptions
- an improved understanding and parametrization of the low fecundity stock-recruit relationship (LFSR)
- catch, CPUE, and size time series updated through 2015;
- a suite of model diagnostics including implementation of an Age Structured Production Model implemented in SS
There remain some uncertainties in the time series based on the quality (observer versus logbook) and timespans of catch and relative abundance indices, limited size composition data for several fisheries, potential under-reporting of catch, and life history parameters.
Extensive model explorations showed that the reference run had the best model performance and showed fits most consistent with the data. The CPUE indices used in the reference case were considered most representative of the North Pacific blue shark stock due to their broader spatial temporal coverage in the core distribution of the stock and the statistical soundness of the standardizations. Alternate CPUE series for the latter part of the time series produced different stock trajectories depending upon the index used, but in each case, median SSB during the last three years exceeded SSBMSY. Using alternate assumptions on stock productivity (i.e., form of the stock recruitment relationship) also resulted in variation in the stock trajectories; assuming stock productivity lower than supported by current biological studies, resulted in lowered spawning stock biomass relative to MSY.
Results of the reference case model showed that the spawning stock biomass was near a time-series high in the late 1970s, declined to its lowest level between 1990 to 1995, subsequently increased gradually to reach the time-series high again in 2005, and has since shown small fluctuations close to the time-series high. Recruitment has fluctuated around 37,000,000 age-0 sharks annually with no apparent trend (Figure 1). Stock status is reported in relation to maximum sustainable yield (MSY) based reference points.
- Female spawning biomass in 2015 (SSB2015) was 69% higher than at MSY and estimated to be 295,774 t (Table 1; Figure 1).
- The recent annual fishing mortality (F2012-2014) was estimated to be well below FMSY at approximately 38% of FMSY (Table 1; Figure 1).
- The reference run produced terminal conditions that were predominately in the lower right quadrant of the Kobe plot (not overfished and overfishing not occurring) (Figure 2).
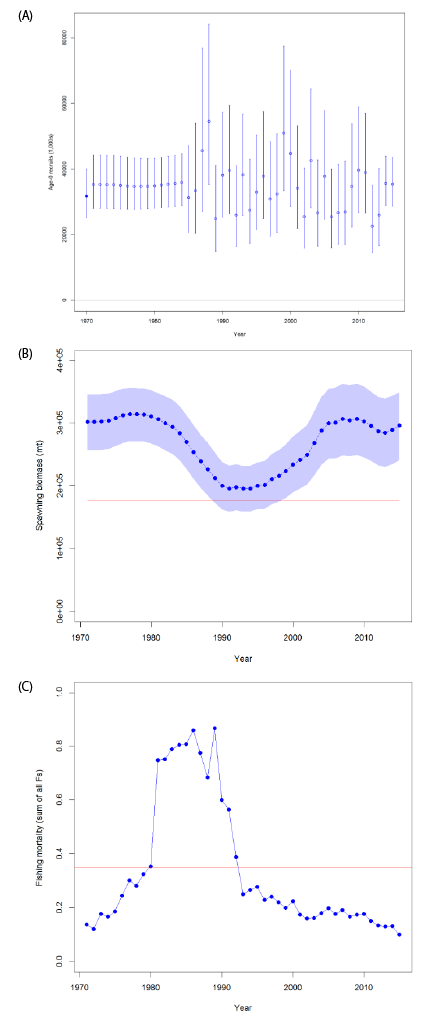
- (A) estimated age-0 recruits (circles) and 95% confidence intervals (vertical bars);
- (B) estimated female spawning biomass and 95% confidence intervals (blue shaded area);
- (C) estimated fishing mortality (sum of F’s across all fishing fleets).
| Management Quantity |
Reference Case Model |
Range for Sensitivity Runs |
|---|---|---|
| SSB1971 | 301,739 t | 174,381 - 980,878 t |
| SSB2015 | 295,774 t | 140,742 - 1,082,300 t |
| SSBMSY | 175,401 t | 100,984 - 482,638 t |
| F1971 | 0.15 | 0.01 - 0.15 |
| F2012-2014 | 0.14 | 0.06 - 0.15 |
| FMSY | 0.36 | 0.26 - 0.66 |
| SSB2015/SSBMSY | 1.69 | 1.39 - 2.59 |
| F2012-2014/FMSY | 0.38 | 0.15 - 0.50 |
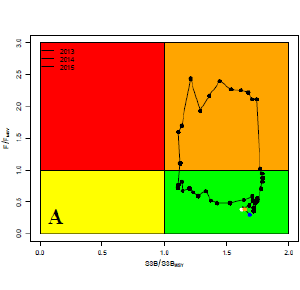
- the SS stock assessment model
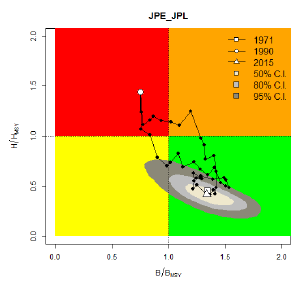
- the BSSPM stock assessment model [Explain CI bands in panel B.]
Conservation Information
Target and limit reference points have not yet been established for pelagic sharks by the WCPFC or the IATTC, the organizations responsible for management of pelagic sharks caught in international fisheries for tuna and tuna-like species in the Pacific Ocean.
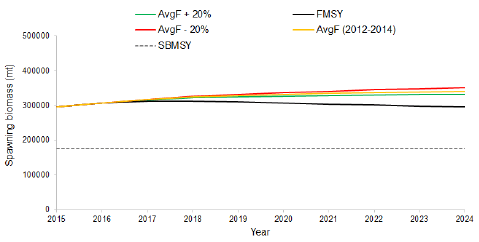
The 2015 SB exceeds SBMSY and F2012-2014 is below FMSY. Future projections under different fishing mortality (F) harvest policies (status quo, +20%, -20%, FMSY) show that median BSH spawning biomass in the North Pacific will likely remain above SBMSY in the foreseeable future (Table 2, Figure 3). Other potential reference points were not considered in these evaluations.
Continued improvements in the monitoring of BSH catches, through carefully designed observer programs and species-specific logbooks, including recording the size and sex of sharks retained and discarded for all fisheries, as well as continued research into the biology and ecology of BSH in the North Pacific are recommended.
| Year | Average F + 20% |
FMSY | Average F - 20% |
Average F (2012-2014) |
|---|---|---|---|---|
| 2015 | 295,774 | 295,774 | 295,774 | 295,774 |
| 2016 | 306,782 | 306,782 | 306,782 | 306,781 |
| 2017 | 316,169 | 312,081 | 318,183 | 317,173 |
| 2018 | 322,317 | 312,329 | 326,829 | 324,559 |
| 2019 | 324,795 | 310,499 | 332,111 | 328,419 |
| 2020 | 326,757 | 307,209 | 336,929 | 331,782 |
| 2021 | 328,323 | 303,909 | 341,210 | 334,675 |
| 2022 | 329,623 | 300,842 | 344,988 | 337,181 |
| 2023 | 330,719 | 298,091 | 348,286 | 339,349 |
| 2024 | 331,656 | 295,663 | 351,138 | 341,218 |