Stock Status and Conservation Advice
(From ISC16 Plenary Report)
Swordfish
Stock Status
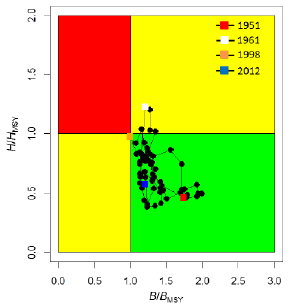
WCNPO: Catches and harvest rates of WCNPO Swordfish (SWO) had a declining trend from 2007-2011, with exploitable biomass fluctuating around 70,000 t. The Kobe plot shows that the WCNPO swordfish stock did not appear to have been overfished or to have experienced overfishing throughout most of the assessment time horizon of 1951-2012 (Figure 1).
Results indicated it was unlikely that the WCNPO swordfish population biomass was below BMSY in 2012 (Pr(B2012 < BMSY)=14% ). Similarly, it was extremely unlikely that the swordfish population was being fished in excess of HMSY in 2012 (Pr(H2012 > HMSY) < 1% ).
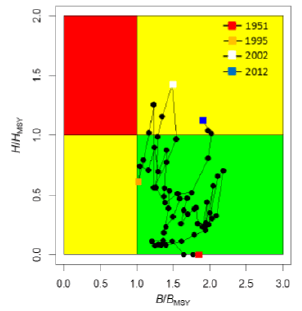
EPO SWO: For the EPO stock, exploitable biomass had a declining trend during 1969-1995 and increased from 31,000 t in 1995 to over 60,000 t in 2010, generally remaining above BMSY. Harvest rates were initially low, have had a long-term increasing trend, and likely exceeded HMSY in 1998, 2002, 2003, as well as in 2012, the terminal year of the stock assessment.
The Kobe plot shows that overfishing likely occurred in only a few years, but may have occurred from 2010 to 2012 (Figure 2). There was a 55% probability that overfishing occurred in 2012, but there was a less than 1% probability that the stock was overfished.
Conservation Advice
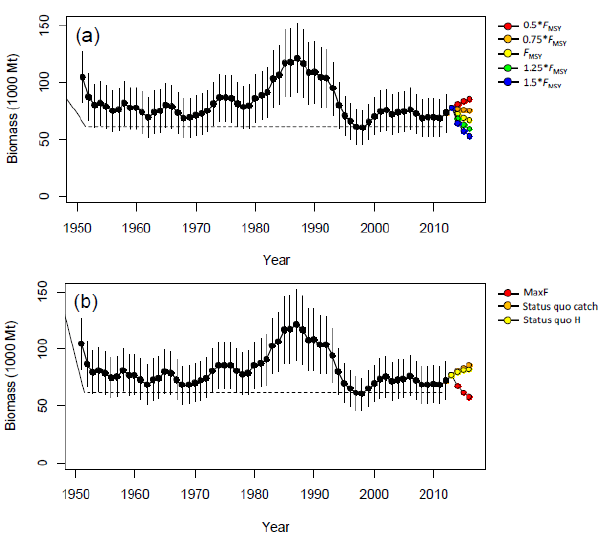
Stochastic projections for the WCNPO stock were conducted using eight harvest scenarios through 2016 (Figure 3 and Figure 4). Results relative to MSY-based reference points indicated that exploitable biomass would likely remain above 60,720 t (BMSY) through 2016 under the status quo catch or status quo harvest rate scenarios (Figure 3). For the high harvest rate scenarios (i.e., maximum observed harvest rate, 150% of HMSY, 125% of HMSY), exploitable biomass was projected to decline below BMSY by 2016 (Figure 3) with harvest rates exceeding HMSY. In comparison, the stock would not be expected to experience any overfishing during 2014-2016 under the status quo catch and status quo harvest rate scenarios (Figure 3).
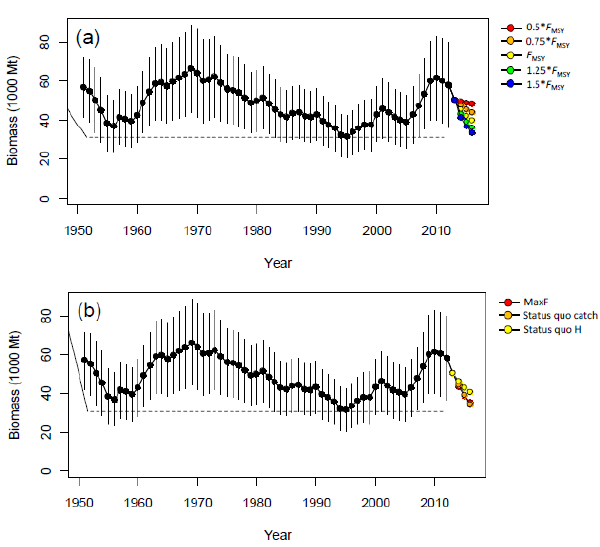
Stochastic projections for the EPO stock show that exploitable biomass will likely have a decreasing trajectory during 2014-2016 under the eight harvest scenarios examined (Figure 4) Under the high harvest rate scenarios (status quo catch, maximum observed harvest rate, 150% of HMSY), exploitable biomass was projected to decline to 31,170 t (BMSY) by 2016 (Figure 4) with corresponding harvest rates above HMSY. In comparison, under the status quo harvest rate scenario, exploitable biomass was projected to decline to only 40,000 t by 2016, well above the BMSY level (Figure 4). Overall, the projections showed that if recent high catch levels (9,700 t) persist, exploitable biomass will decrease and a moderate risk (50%) of overfishing will continue to occur.
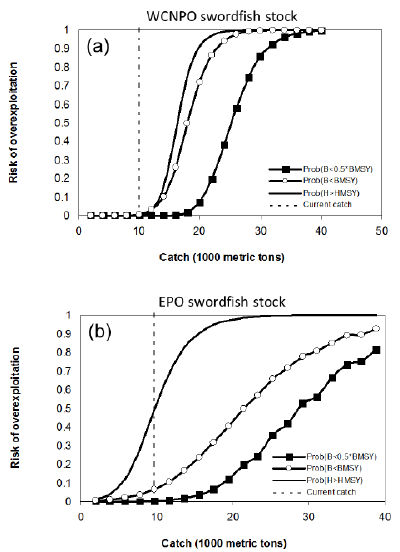
The risk analyses of harvesting a constant annual catch of WCNPO SWO during 2014-2016 showed that there would be less than 1% probability of the stock being overfished or experiencing overfishing in 2016 (Figure 5) if current annual catches (2011-2012) of about 10,000 t were maintained.
The risk analyses for harvesting a constant catch of EPO SWO during 2014-2016 showed that the probabilities of overfishing and becoming overfished increased as projected catch increased in the future (Figure 5). Maintaining the current (2010-2012) catch of EPO SWO of approximately 9,700 t would lead to a 50% probability of overfishing in 2016 and a less than 1% probability of the stock being overfished in 2016 (see Figure 5, panel (b)).
The WCNPO SWO stock is healthy (B2010-2012>BMSY) and is above the level required to sustain recent harvest rates (H2010-2012<HMSY).
For the EPO SWO stock, overfishing may have occurred from 2010 to 2012, and the average yield of roughly 10,000 t in those years, or almost two times higher than the estimated MSY, is not likely to be sustainable in the long term. While biomass of the EPO stock appears to be nearly twice BMSY, any increases in catch above recent (3-year average 2010-2012) levels should consider the uncertainty in stock structure and unreported catch.