Stock Status and Conservation Advice
(From ISC16 Plenary Report)
Blue marlin
Stock Status
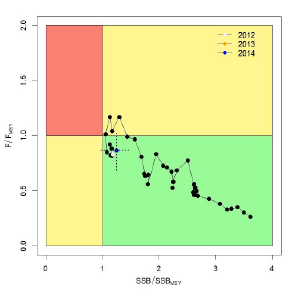
Estimates of total Blue marlin (BUM) stock biomass show a long term decline. Population biomass (age-1 and older) averaged roughly 130,965 t in 1971-1975, the first 5 years of the assessment time frame, and has declined by approximately 40% to 78,082 t in 2014 (Figure 1). Female spawning biomass was estimated to be 24,809 t in 2014, or about 25% above SSBMSY (Table 1 and Table 2). Fishing mortality on the stock (average F, ages 2 and older) averaged roughly F = 0.28 during 2012-2014, or about 12% below FMSY. The estimated spawning potential ratio of the stock (SPR, the predicted spawning output at the current F as a fraction of unfished spawning output) is currently SPR2012-2014 = 21%. Annual recruitment averaged about 897,000 recruits during 2008-2014, and no long-term trend in recruitment was apparent. Overall, the time series of spawning stock biomass and recruitment estimates indicate a long-term decline in spawning stock biomass and suggest a fluctuating pattern without trend for recruitment (Figure 1). The Kobe plot depicts the stock status relative to MSY-based reference points for the base case model (Figure 2) and shows that spawning stock biomass decreased to roughly the MSY level in the mid-2000s, and has increased slightly in recent years (Table 1 and Table 2).
Based on the results of this 2016 stock assessment update, the Pacific blue marlin stock is not currently overfished and is not experiencing overfishing. Because Pacific blue marlin is mainly caught as bycatch, direct control of the annual catch amount through the setting of a total allowable catch may be difficult.
| Year | 2008 | 2009 | 2010 | 2011 | 2012 | 2013 | 2014 | Mean1 | Min1 | Max1 |
|---|---|---|---|---|---|---|---|---|---|---|
| Reported Catch | 17,828 | 18,282 | 20,086 | 18,165 | 19,407 | 20,727 | 20,356 | 18,232 | 9,160 | 25,589 |
| Population Biomass | 71,768 | 69,720 | 72,696 | 72,995 | 76,697 | 78,761 | 78,082 | 101,149 | 69,720 | 135,623 |
| Spawning Biomass | 22,706 | 23,065 | 22,392 | 23,182 | 23,432 | 24,771 | 24,809 | 41,717 | 20,972 | 71,807 |
| Relative Spawning Biomass | 1.14 | 1.16 | 1.13 | 1.17 | 1.18 | 1.25 | 1.25 | 2.10 | 1.06 | 3.62 |
| Recruitment (age 0) | 687 | 1031 | 702 | 1061 | 763 | 909 | 839 | 897 | 589 | 1181 |
| Fishing Mortality | 0.27 | 0.29 | 0.30 | 0.26 | 0.27 | 0.28 | 0.28 | 0.22 | 0.09 | 0.38 |
| Relative Fishing Mortality | 0.82 | 0.88 | 0.92 | 0.82 | 0.83 | 0.87 | 0.87 | 0.67 | 0.26 | 1.17 |
| Spawning Potential Ratio | 22% | 21% | 20% | 22% | 22% | 21% | 21% | 31% | 15% | 57% |
| Reference Point | Estimate |
|---|---|
| FMSY (age 2+) | 0.32 |
| F20% (age 2+) | 0.30 |
| F2012-2014 (age 2+) | 0.28 |
| SSBMSY | 19,853 mt |
| SSB20% | 22,727 mt |
| SSB2014 | 24,809 mt |
| MSY | 19,901 mt |
| C2012-2014 | 20,163 mt |
| SPRMSY | 0.18 |
| SPR2012-2014 | 0.21 |
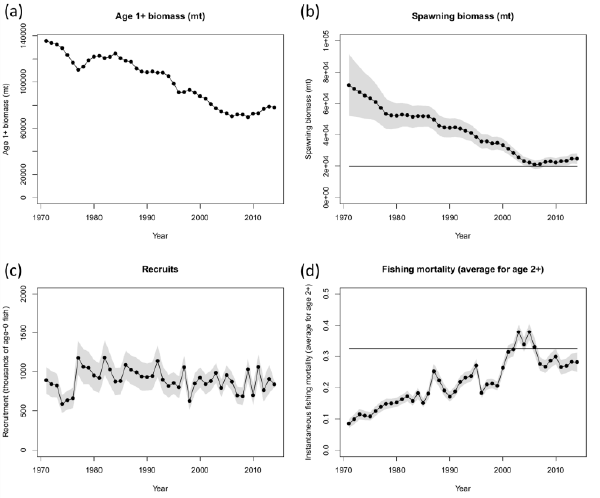
- population biomass (age 1+)
- female spawning biomass
- recruitment (age-0 fish)
- instantaneous fishing mortality (average for age 2+, year-1)
Conservation Advice
Since the stock is nearly full exploited, the ISC recommends that fishing mortality remain at or below current levels (2012-2014).