Stock Status and Conservation Advice
(From ISC16 Plenary Report)
- Albacore
- Pacific Bluefin
- Blue Marlin
- Striped Marlin
- Swordfish
- Blue shark
- Shortfin mako
Pacific Bluefin Tuna
Stock Status
The Pacific Bluefin (PBF) Working Groups conducted a benchmark assessment (base-case model) using the best available fisheries and biological information. The base-case model fits well the data that were considered to be more reliable and is internally consistent among most of the sources of data. The 2016 base-case model is a substantial improvement compared to the 2014 assessment and fits all reliable data well.
The base-case model indicates:
- spawning stock biomass (SSB) fluctuated throughout the assessment period
(fishing years 1952-2014) and - the SSB steadily declined from 1996 to 2010; and
- the decline appears to have ceased since 2010, although the stock remains near the historic low.
The model diagnostics suggest that the estimated biomass trend for the last 30 years is considered robust although SSB prior to the 1980s is uncertain due to data limitations.
Using the base-case model, the 2014 (terminal year) SSB was estimated to be around 17,000 t (Figure 1), which is about 9,000 t below the terminal year estimated in the 2014 assessment (26,000 in 2012). This is because of improvements to the input data and refinements to the assessment model scaled down the estimated value of SSB and not because the SSB declined from 2012 to 2014.
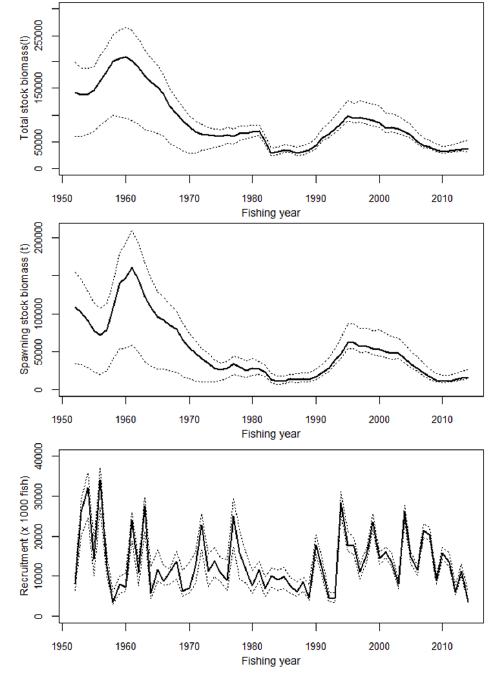
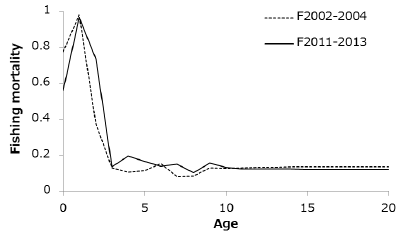
Recruitment estimates fluctuate widely without an apparent trend. The 2014 recruitment was relatively low, and the average recruitment for the last five years may have been below the historical average level (Figure 1). Note that recruitments in terminal years in an assessment are highly uncertain due to limited information on the cohorts. However, two of the last three data points from the Japanese troll CPUE-based index of recruitment, which was consistent with other data in the model, are at their lowest level since the start of the index (1980). Estimated age-specific fishing mortalities on the stock during 2011-2013 and 2002-2004 (the base period for WCPFC CMM 2015-04) are presented in Figure 2. Most age-specific fishing mortalities (F) for intermediate ages (2-10 years) are substantially above F2002-2004 while those for age 0 as well as ages 11 and above are lower (Table 1).

Although no limit reference points have been established for the PBF stock under the auspices of the WCPFC and IATTC, the F2011-2013 exceeds all calculated biological reference points except for FMED and FLOSS despite slight reductions to F in recent years (Table 2). The ratio of SSB in 2014 relative to the theoretical 1 2 and SSB2012/SSBF=0 is 2.1% indicating a slight increase from 2012 to 2014. Although the SSB2014/SSBF=0 for this assessment (2.6%) is lower than SSB2012/SSBF=0 from the 2014 assessment (4.2%), this difference is due to improvements to the input data and model structure (Figure 1) rather than a decline in SSB from 2012 to 2014. Note that potential effects on Fs as a result of the measures of the WCPFC and IATTC starting in 2015 or by other voluntary measures are not yet reflected in the data used in this assessment.
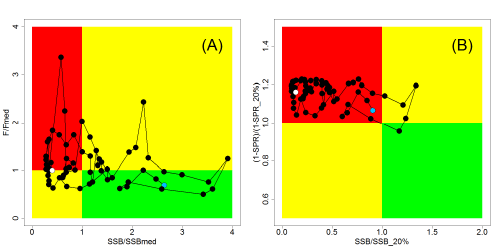
Since reference points for PBF have yet to be identified, two examples of Kobe plots (Figure 3: plot A based on SSBMED and FMED, plot B based on SSB20% and SPR20%) are presented. These versions of the Kobe plot represent two interpretations of stock status in an effort to prompt further discussion. In summary, if these were the reference points, overfishing would be occurring or just at the threshold in the case of FMED; and the stock would be considered overfished. Plot B shows that the stock has remained in an overfished and -overfishing status for the vast majority of the assessment period if F20% and SSB20% are the reference points. The ISC notes that the SSB estimates before 1980 are more uncertain and that the reason why the fishing mortality is estimated to be so high right after the WWII is not well understood. The low biomass level at the beginning of the assessment period (1952) could potentially be the result of relatively high catches prior to the assessment period.
| Fmax | F0.1 | Fmed | Floss | F10% | F20% | F30% | F40% | Estiamted SSB for terminal year of each reference period |
Depletion ratio for terminal year of each reference period |
|
|---|---|---|---|---|---|---|---|---|---|---|
| 2002-2004 | 1.86 | 2.59 | 1.09 | 0.80 | 1.31 | 1.89 | 2.54 | 3.34 | 41,069 | 0.064 |
| 2009-2011 | 1.99 | 2.78 | 1.17 | 0.85 | 1.41 | 2.03 | 2.72 | 3.58 | 11,860 | 0.018 |
| 2011-2013 | 1.63 | 2.28 | 0.96 | 0.70 | 1.15 | 1.66 | 2.23 | 2.94 | 15,703 | 0.024 |
- SSBMED and FMED
- SSB20% and SPR20% based
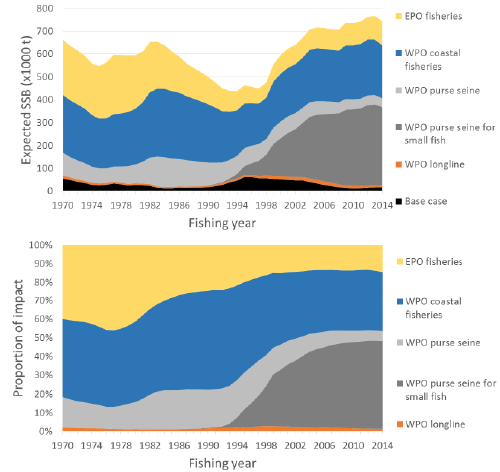
Historically, the WPO coastal fisheries group has had the greatest impact on the PBF stock, but since about the early 1990s the WPO purse seine fleets, in particular those targeting small fish (age 0-1), have had a greater impact, and the effect of these fleets in 2014 was greater than any of the other fishery groups. The impact of the EPO fishery was large before the mid-1980s, decreasing significantly thereafter. The WPO longline fleet has had a limited effect on the stock throughout the analysis period (Figure 4). This is because the impact of a fishery on a stock depends on both the number and size of the fish caught by each fleet; i.e., catching a high number of smaller juvenile fish can have a greater impact on future spawning stock biomass than catching the same weight of larger mature fish.
| WPO longline | :F1, F12, F17 |
| WPO purse seine for small fish | :F2, F3, F18 |
| WPO purse seine | :F4, F5 |
| WPO coastal fisheries | :F6-11, F16, F19 |
| EPO fisheries | :F13, F14, F15 |
Conservation Advice
The steady decline in SSB from 1996 to 2010 appears to have ceased, although SSB2014 is near the historic low and the stock is experiencing exploitation rates above all calculated biological reference points except for FMED and FLOSS.
The projection results based on the base-case model under several harvest and recruitment scenarios and time schedules are shown in Table 4 and Figure 5. Under all examined scenarios the initial goal of WCPFC, rebuilding to SSBMED by 2024 with at least 60% probability, is reached and the risk of SSB falling below SSBLOSS at least once in 10 years was low.
The projection results indicate that the probability of SSB recovering to the initial WCPFC target (SSBMED by 2024, 38,000 t, calculated in the same manner as the previous assessment) is 69% or above the level prescribed in the WCPFC CMM if low recruitment scenario is assumed and WCPFC CMM 2015-04 and IATTC Resolution C-14-06 continue in force and are fully implemented (Table 3: Scenario 2 with low recruitment).
The ISC notes there are technical inconsistencies in the calculation of SSBMED in the assessment and projection. The ISC also notes the current calculation of SSBMED in the projection includes the most recent estimates of SSB and unless a fixed period of years is specified to calculate SSBMED, the calculation of SSBMED could be influenced by future trends in spawning biomass. The ISC therefore recommends defining SSBMED as the median point estimate for a fixed period of time, either, 1952-2012 or 1952-2014. If 1952-2012 is chosen, then SSBMED is estimated to be 41,069 t, and if 1952-2014 is chosen, SSBMED is 40,994 t. The probabilities of achieving 41,000 t under various scenarios are provided in Table 4. The probabilities of achieving 43,000 t, where WCPFC CMM 2015-04’s initial rebuilding target is specified as 42,592 t, are also provided in Table 4, although this value is derived from the previous assessment and is higher than the SSBMED calculated in the current assessment. The ISC recommends that in the future absolute values should not be used for the initial rebuilding target, as the calculated values of reference points would change from assessment to assessment.
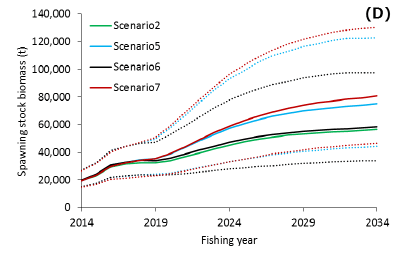
Scenario 2 with low recruitment has the lowest prospect of recovery among the examined harvest scenarios. The probability of achieving the WCPFC’s initial target (SSBMED by 2024) would increase if more conservative management measures were implemented as shown in Table 4 and Figure 5. The projection results indicate that a 10% reduction in the catch limit for fish smaller than the weight threshold in CMM 2015-04 would have a larger effect on recovery than a 10% reduction in the catch limit for fish larger than the weight threshold. (Figure 5 (D)). The ISC notes that the current assessment model uses a maturity ogive that assumes 20%, 50% and 100% maturity in age 3 (weight on July 1: 34kg), 4 (weight on July 1: 58kg) and 5 (weight on July 1: 85kg), respectively, while the WCPFC CMM 2015-04 specifies that catches of fish smaller than 30kg should be reduced. The weight threshold in the CMM needs to be increased to 85kg (weight of age 5) if the intent is to reduce catches on all juveniles according to the maturity ogive in the assessment.
The projections results assuming a stronger stock-recruitment relationship (where h=0.9) than in the assessment model are not necessarily more pessimistic than the low recruitment scenario. The projection results assume that the CMMs are fully implemented and are based on certain biological or other assumptions. In particular, the ISC noted the implementation of size based management measures need to be monitored carefully. If conditions change, the projection results would be more uncertain. Given the low SSB, the uncertainty in future recruitment, and the influence of recruitment has on stock biomass, monitoring recruitment and SSB should be strengthened so that the recruitment trends can be understood in a timely manner.

- * Fleets whose size data were fitted.
- ** The size data was combined with another Fleet and was fitted.


- * Catch limits for EPO commercial fisheries is applied for all the catch (small and large fish) made by the Fleets.
- ** Average recruitment refers to the recruitment for the whole assessment period while low recruitment refers to that of 1980-1989.
- *** Probability that SSB exceeds 41,000 tons (SSB median of Basecase model) developed by PBFWG at ISC16 Plenary.
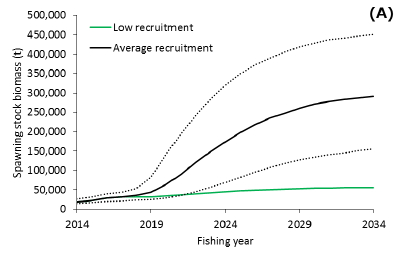
- low recruitment vs. historical average recruitment (Scenario 2).
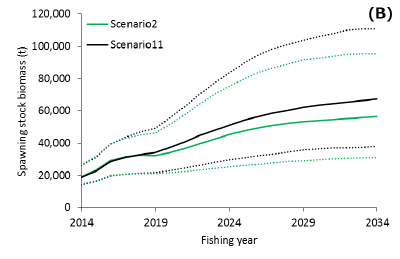
- current CMMs (Scenario 2) vs. current F (Scenario 11) (low recruitment). The solid lines indicate median of bootstrapped projection results and dotted lines indicate 90% confidence interval. Comparisons of various projection results for PBF.
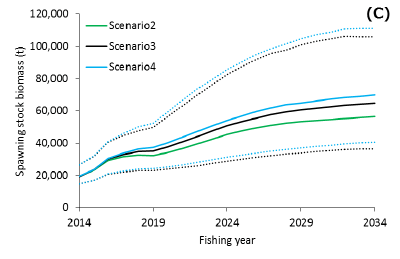
- different definition of small fish (30kg (Scenario 2) vs. 50kg (Scenario 3) vs. 80kg (Scenario 4)) (low recruitment).
- current CMMs (Scenario 2) vs. additional 10% catch limit reduction for small fish (Scenario 5), for large fish (Scenario 6) and for all fish (Scenario 7) (low recruitment).