Stock Status and Conservation Information
(From ISC18 Plenary Report)
- Albacore
- Pacific Bluefin
- Blue Marlin
- Striped Marlin
- Swordfish
- Blue shark
- Shortfin mako
Shortfin Mako Shark
The reproductive capacity of the North Pacific SMA stock was calculated as spawning abundance (SA; i.e., number of mature female sharks) rather than spawning biomass, because the number of pups produced is not related to female size (i.e., larger female sharks do not produce more pups). Spawning potential ratio (SPR) was used to describe the impact of fishing on this stock. The SPR of this population is the ratio of SA per recruit under fishing to the SA per recruit under virgin (or unfished) conditions. Therefore, 1-SPR is the reduction in the SA per recruit due to fishing and can be used to describe the overall impact of fishing on a fish stock.
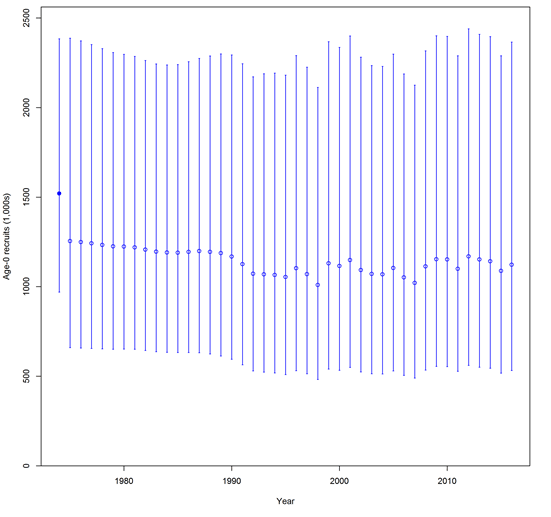
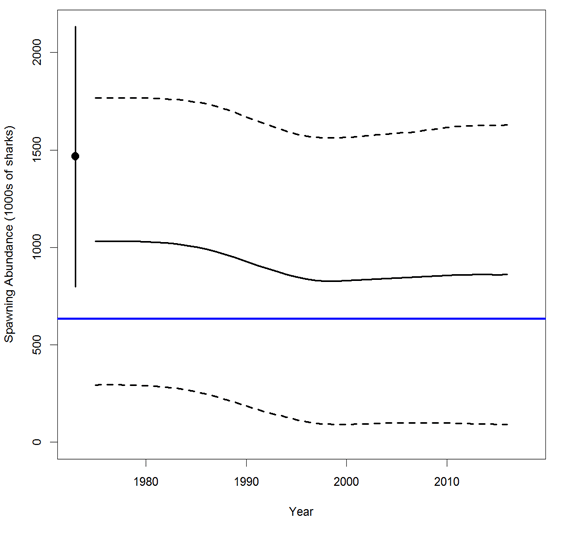
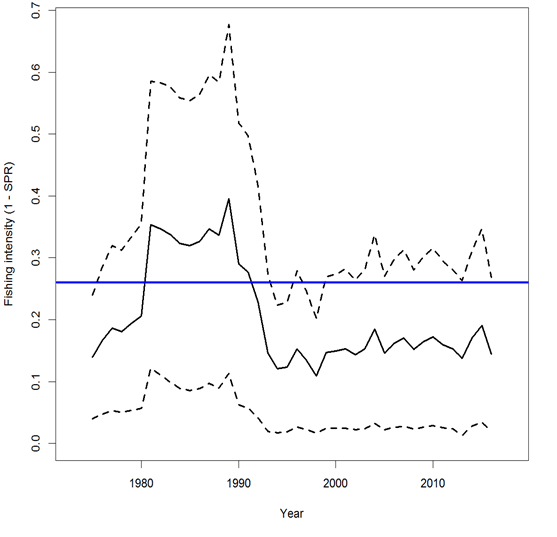
Recruitment was estimated on average to be 1.1 million age-0 sharks during the modeling timeframe (1975-2016) (Figure 1A). During the same period, the SA was estimated, on average, to be 910,000 sharks (Figure 1B). The current spawning abundance (SA2016) was estimated to be 860,200 sharks (CV=46%) and was 36% (CV=30%) higher than the estimated spawning abundance at MSY (SAMSY). The recent annual fishing intensity (1-SPR2013-2015) was estimated to be 0.16 (CV=38%) and was 62% (CV=38%) of fishing intensity at MSY (1-SPRMSY; 0.26) (Figure 1C).
 (B)
(B)
 (C)
(C)
- (A) age-0 recruitment,
- (B) spawning abundance (SA; number of mature female sharks), and
- (C) fishing intensity (1-SPR),
- Error bars around recruitment estimates (A) show the 95% confidence intervals; and closed circle indicates recruitment under unfished conditions.
- Dashed lines in (B) show the 95% confidence intervals of SA; and closed circle and error bars indicate the estimated SA and 95% confidence intervals under unfished conditions (SA0). The blue solid line shows the estimate of SA at maximum sustainable yield (SAMSY) in the base case model.
- Dashed lines in (C) show the 95% confidence intervals. Blue solid line is the estimate of fishing intensity (1-SPR) at maximum sustainable yield (1-SPRMSY).
Stock Status
Based on these findings, the following information on the status of the SMA stock is provided:
- Target and limit reference points have not been established for pelagic sharks in the Pacific Ocean. Stock status is reported in relation to MSY.
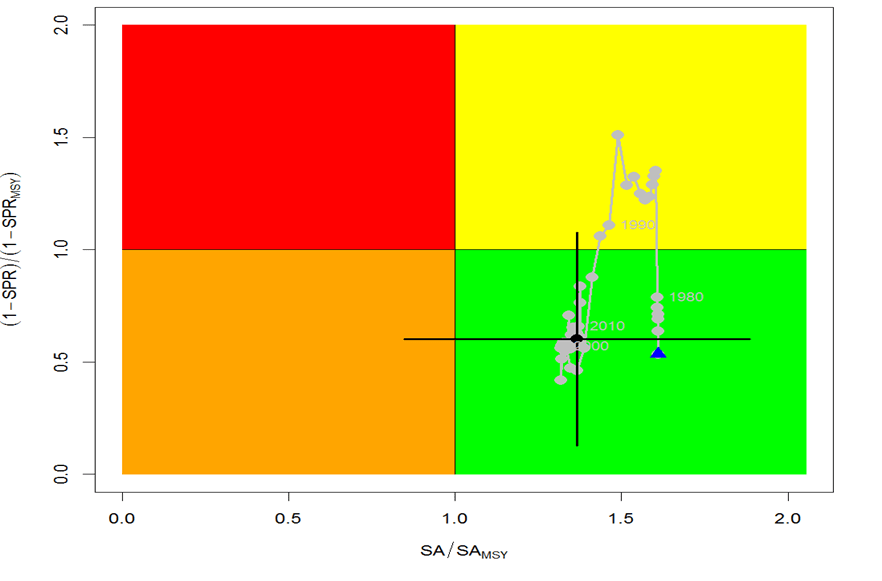
- The results from the base case model show that, relative to MSY, the North Pacific shortfin mako stock is likely (>50%) not in an overfished condition and overfishing is likely (>50%) not occurring relative to MSY-based abundance and fishing intensity reference points (Table 1; Figure 2A).
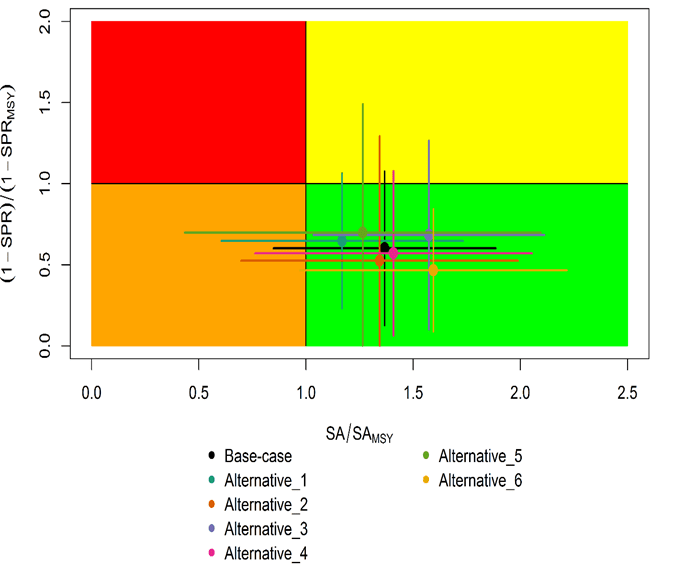
Stock status was also examined under six alternative states of nature that represented the most important sources of uncertainty in the assessment. Results of these models with alternative states of nature were consistent with the base case model and showed that, relative to MSY, the SMA stock is likely (>50%) not in an overfished condition and overfishing is likely (>50%) not occurring (Figure 2B).
| Management Quantity | Symbol | Units | Basecase |
|---|---|---|---|
| Spawning abundance (number of mature female sharks) |
SA0 | 1000s of sharks | 1465.8 (23.3%) |
| Maximum Sustainable Yield (MSY) | CMSY | Metric tonnes (t) | 3127.1 (22.2%) |
| Spawning Abundance at MSY | SAMSY | 1000s of sharks | 633.7 (23.3%) |
| Fishing Intensity at MSY | 1-SPRMSY | NA | 0.26 |
| Current spawning abundance relative to MSY |
SA2016/SAMSY | NA | 1.36 |
| Current spawning abundance relative to unfished level |
SA2016/SA0 | NA | 0.58 |
| Recent fishing Intensity relative to MSY |
(1-SPR2013-15) /(1-SPRMSY) |
MSY | 0.62 |
 (B)
(B)
- (A) the time series of the ratio of SA to SA at MSY (SAMSY) and fishing intensity to fishing intensity at MSY (1-SPRMSY), and
- (B) the same ratios for the terminal year (2016) for six alternative states of nature.
SA is spawning abundance measured as the number of mature females. Fishing intensity is estimated as 1-SPR.
Values for the start (1975) and end (2016) years in the time series (A) are indicated by the blue triangle and black circle, respectively. Black error bars are 95% confidence intervals. Gray numbers indicate selected years.
- higher catch;
- lower catch;
- higher uncertainty on Japan shallow-set CPUE index (1975-1993) (CV=0.3);
- fit to Japan offshore distant water longline shallow-set fleet (JPN_SS_I; 1975-2016) and Hawaii longline shallow-set fleet (US_SS; 2005-2016), and no fit to initial equilibrium catch;
- low steepness, h=0.260; and
- high steepness, h=0.372.
Conservation Information
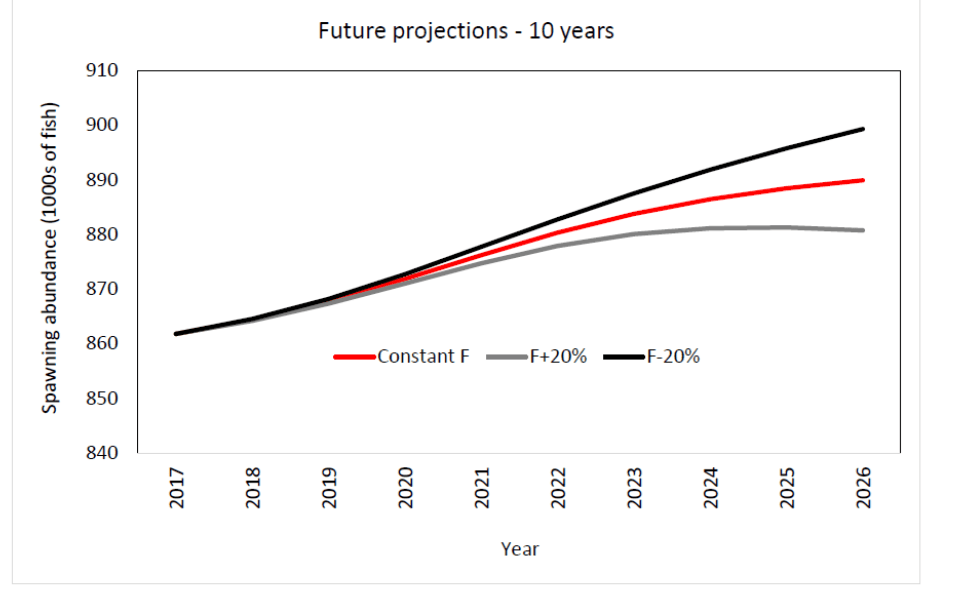
Stock projections of biomass and catch of SMA from 2017 to 2026 were performed assuming three alternative constant fishing mortality scenarios: 1) status quo, average of 2013-2015 (F2013-2015); 2) F2013-2015 + 20%; and 3) F2013-2015 - 20% (Figure 3).
Based on these future projections, the following conservation information is provided:
- If fishing mortality remains constant at F2013-15 or is decreased 20%, then the SA is expected to increase gradually;
- If fishing mortality is increased 20% relative to F2013-2015, then the SA is expected to decrease in the final years of the projection.
- It should be noted that, given the uncertainty in fishery data and key biological processes within the model, especially the stock recruitment relationship, the models Eability to project into the future is highly uncertain.
Research Needs
There is uncertainty in the estimated historical catches of SMA. Substantial time and effort was spent on estimating historical catch and more work remains to be conducted. In particular, the SHARKWG identified two future improvements that are critical: 1) identify all fisheries that catch SMA in the NPO, including fisheries that catch SMA not previously identified by the SHARKWG; and 2) methods to estimate SMA catches should be improved, especially for the early period from 1975 to 1993.
