Stock Status and Conservation Information
(From ISC18 Plenary Report)
- Albacore
- Pacific Bluefin
- Blue Marlin
- Striped Marlin
- Swordfish
- Blue shark
- Shortfin mako
Pacific Bluefin Tuna
The base-case model results show that: (1) SSB fluctuated throughout the assessment period, (2) SSB steadily declined from 1996 to 2010; and (3) the slow increase of the stock continues since 2011 including the most recent two years (2015-2016). Based on the model diagnostics, the estimated biomass trend for the last 30 years is considered robust although SSB prior to the 1980s is uncertain due to data limitations. Using the base-case model, the 2016 SSB (terminal year) was estimated to be around 21,000 t in the 2018 assessment, which is an increase from 19,000 t in 2014 (Table 1 and Figure 1).
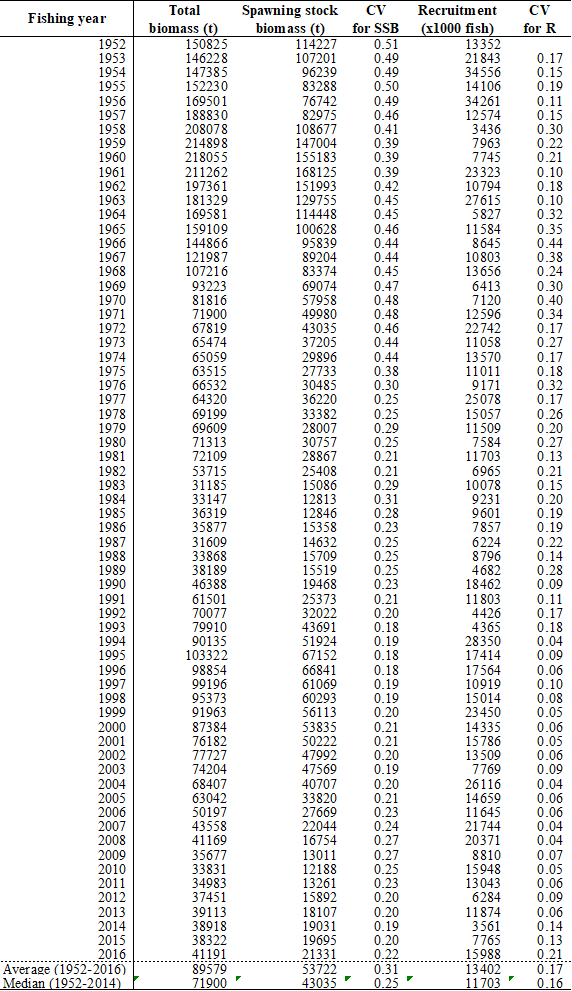
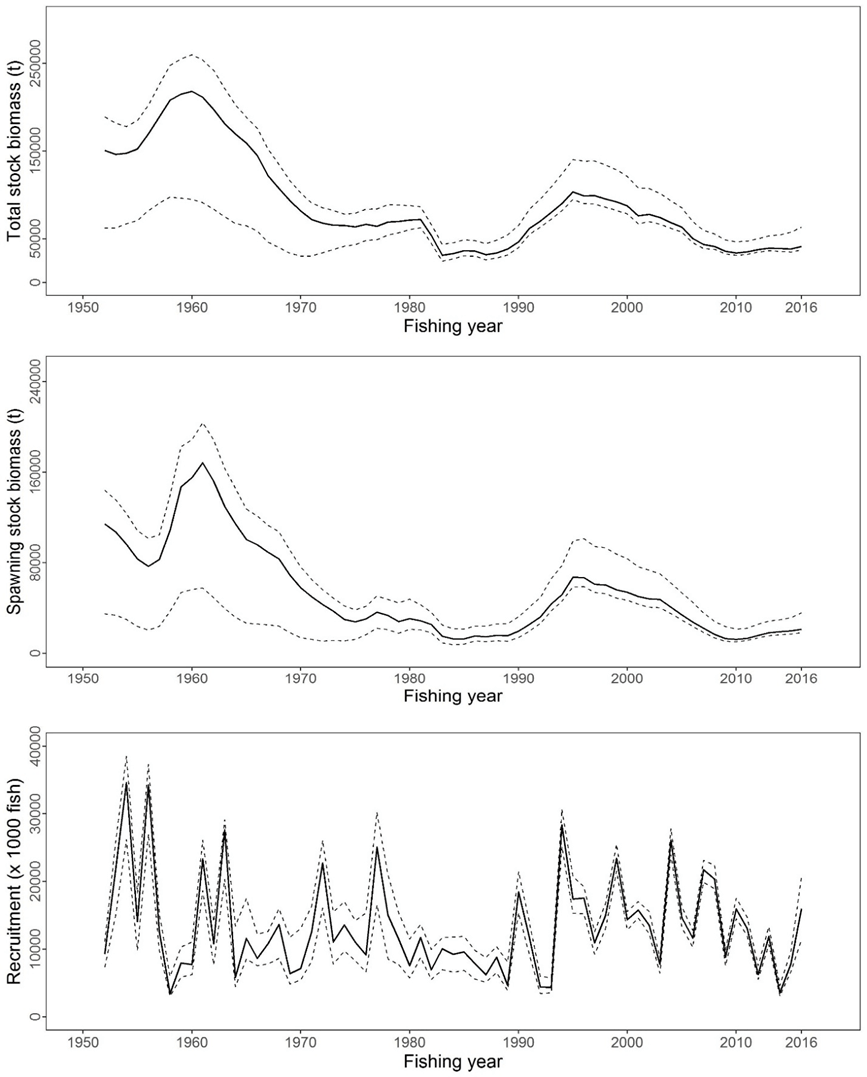
Historical recruitment estimates have fluctuated since 1952 without an apparent trend. The low recruitment levels estimated in 2010-2014 were a concern in the 2016 assessment. The 2015 recruitment estimate is lower than the historical average while the 2016 recruitment estimate (15.988 million fish) is higher than the historical average (13.402 million fish) (Figure 2, Table 1). The uncertainty of the 2016 recruitment estimate is higher than in previous years because it occurs in the terminal year of the assessment and is mainly informed by one observation from the troll age-0 CPUE index. The troll CPUE series has been shown to be a good predictor of recruitment, with no apparent retrospective error in the recruitment estimates of the terminal year given the current model construction. As the 2016 recruits grow and are observed by other fleets, the magnitude of this year class will be more precisely estimated in the next stock assessment. The above average recruitment estimated in 2016 had a positive impact on the projection results.
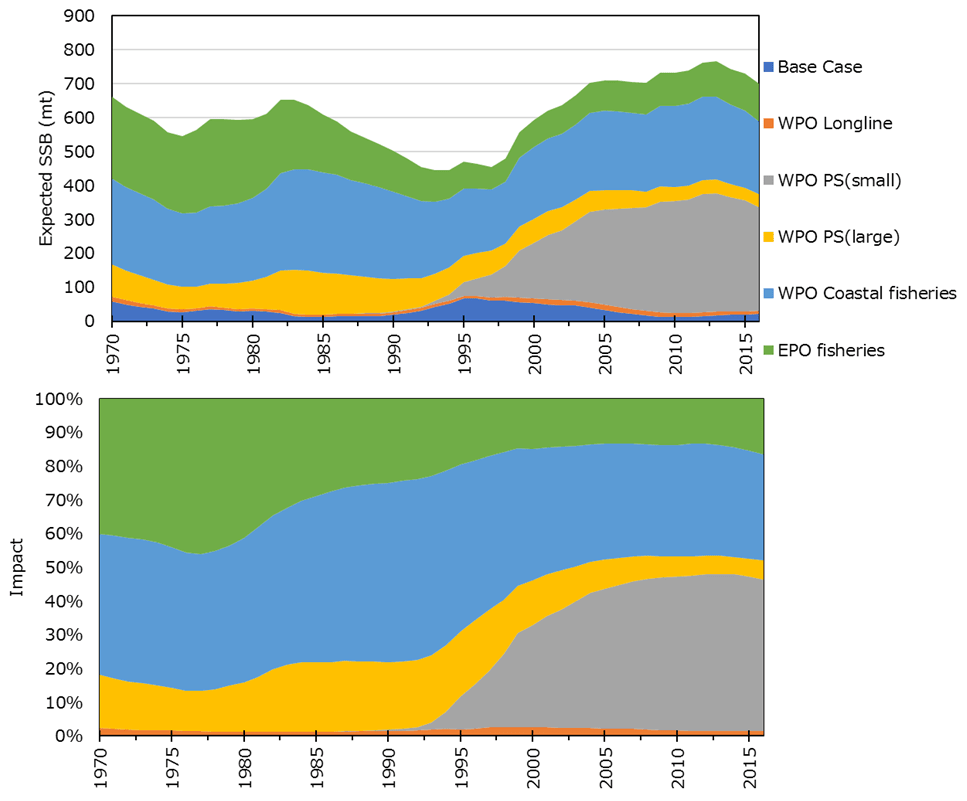
- WPO longline: F1, F12, F17.
- WPO purse seine for small fish: F2, F3, F18.
- WPO purse seine: F4, F5.
- WPO coastal fisheries: F6-11, F16, F19.
- EPO fisheries: F13, F14, F15.
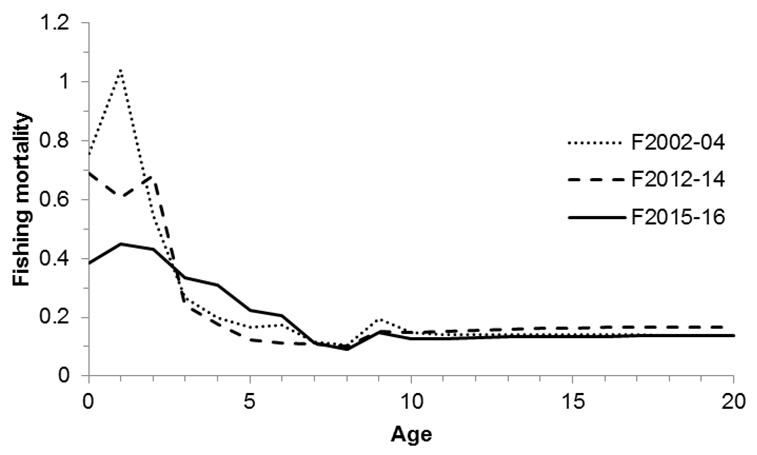
Estimated age-specific fishing mortalities (F) on the stock during the periods 2012-2014 and 2015 2016 compared with 2002-2004 estimates (the base period for the WCPFC Conservation and Management Measure) are presented in Figure 3. A substantial decrease in estimated F is observed in ages 0-2 in 2015-2016 from the previous years. Note that stricter management measures in the WCPFC and IATTC have been in place since 2015.
The 2018 assessment estimated the initial rebuilding biomass target to be 6.7%SSBF=0 and the corresponding fishing mortality expressed as SPR of F6.7%SPR (Table 2). SPR is the ratio of the cumulative spawning biomass that an average recruit is expected to produce over its lifetime when the stock is fished at the current intensity to the cumulative spawning biomass that could be produced by an average recruit over its lifetime if the stock was unfished. Because the projections include catch limits, fishing mortality is expected to decline, i.e., Fx%SPR will increase, as biomass increases. The Kobe plot shows that the point estimate of the SSB2016 was 3.3%SSBF=0 and the 2016 fishing mortality corresponds to F6.7%SPR (Figure 4). Table 3 provides an evaluation of stock status against some common reference points. It shows that the PBF stock is overfished relative to biomass-based limit reference points adopted for other species in WCPFC (20%SSBF=0) and is subject to overfishing relative to most of the common fishing intensity-based reference points.
| initial rebuilding target | Second rebuilding target | 1995 (recent high) |
2002-2004 (reference year) |
2011 (5 years ago) |
2016 (latest) |
|
|---|---|---|---|---|---|---|
| Biomass (%SSBF=0) |
SSB median 1952-2014 = 6.7% |
20% | 10.4% | 7.1% | 2.1% | 3.3% |
| SPR | 6.7% | 20% | 5.1% | 3.4% | 4.9% | 6.7% |
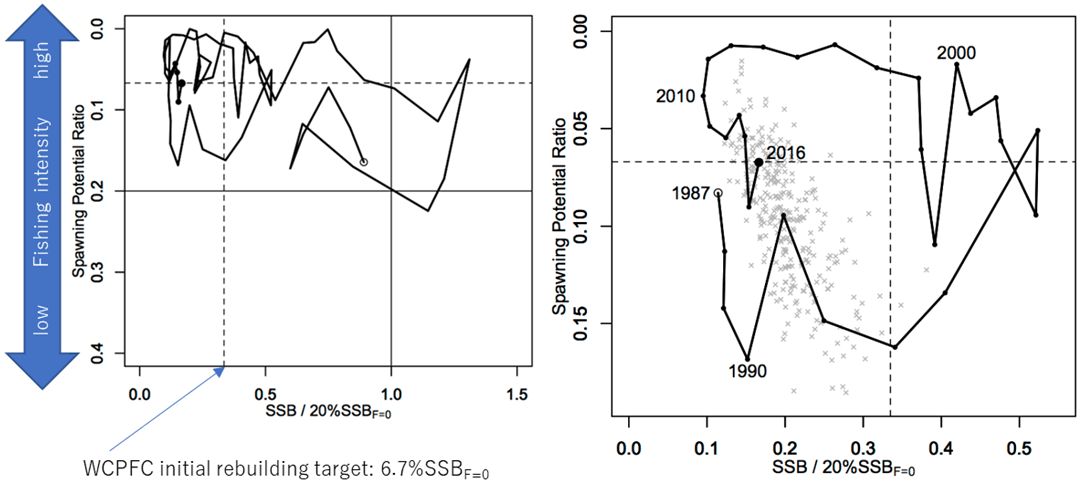
- Solid vertical and horizontal lines in the left figure show 20%SSBF=0 (which corresponds to the second biomass rebuilding target) and the corresponding fishing intensity, respectively.
- Dashed vertical and horizontal lines in both figures show the initial biomass rebuilding target (SSBMED = 6.7%SSBF=0) and the corresponding fishing intensity, respectively.
- SSBMED is calculated as the median of estimated SSB over 1952-2014.
- The left figure shows the historical trajectory, where the open circle indicates the first year of the assessment (1952) while solid circles indicate the last five years of the assessment (2012-2016).
- The right figure shows the trajectory of the last 30 years, where grey dots indicate the uncertainty of the terminal year.

Figure 2 depicts the historical impacts of the fleets on the PBF stock, showing the estimated biomass when fishing mortality from respective fleets is zero. Historically, the WPO coastal fisheries group has had the greatest impact on the PBF stock, but since about the early 1990s the WPO purse seine fleets, in particular those targeting small fish (ages 0-1), have had a greater impact, and the effect of these fleets in 2016 was greater than any of the other fishery groups. The impact of the EPO fishery was large before the mid-1980s, decreasing significantly thereafter. The WPO longline fleet has had a limited effect on the stock throughout the analysis period, because the impact of a fishery on a stock depends on both the number and size of the fish caught by each fleet; i.e., catching a high number of smaller juvenile fish can have a greater impact on future spawning stock biomass than catching the same weight of larger mature fish.
Stock Status
Based on these findings, the following information on the status of the Pacific bluefin tuna stock is provided:
- No biomass-based limit or target reference points have been adopted to evaluate the overfished status for PBF. However, the PBF stock is overfished relative to the potential biomass-based reference points evaluated (SSBMED and 20%SSBF=0, Table 3 and Figure 4).
- No fishing intensity-based limit or target reference points have been adopted to evaluate overfishing for PBF. However, the PBF stock is subject to overfishing relative to most of potential fishing intensity-based reference points evaluated (Table 3 and Figure 4).
Conservation Information
After the steady decline in SSB from 1995 to the historical low level in 2010, the PBF stock appears to have started recovering slowly. The 2016 stock biomass is below the two biomass rebuilding targets adopted by the WCPFC while the 2015-16 fishing intensity (spawning potential ratio) is at a level corresponding to the initial rebuilding target.
The 2018 base case assessment results are consistent with the 2016 model results. However, the 2018 projection results are more optimistic than the 2016 projections, mainly due to the inclusion of the relatively good recruitment in 2016, which is above the historical average level (119%) and twice as high as the median of the low recruitment scenario (which occurred 1980-1989).
Based on these results, the following conservation information is provided:
- The projection based on the base-case model mimicking the current management measures by the WCPFC (CMM 2017-08) and IATTC (C-16-08) under the low recruitment scenario resulted in an estimated 98% probability of achieving the initial biomass rebuilding target (6.7%SSBF=0) by 2024. This estimated probability is above the threshold (75% or above in 2024) prescribed by the WCPFC Harvest Strategy (Harvest Strategy 2017-02) (scenario 0 of Table 4 to Table 6; See also Figure 5 and Figure 6). The low recruitment scenario is more precautionary than the recent 10 years recruitment scenario.
- The Harvest Strategy specifies that recruitment switches from the low recruitment scenario to the average recruitment scenario beginning in the year after achieving the initial rebuilding target. The estimated probability of achieving the second biomass rebuilding target (20%SSBF=0) 10 years after the achievement of the initial rebuilding target or by 2034, whichever is earlier, is 96% (scenario 1 of Tables Table 3, Table 4, and Table 5; Figure 5 and Figure 6). This estimate is above the threshold (60% or above in 2034) prescribed by the WCPFC Harvest Strategy. However, it should be recognized that these projection results are strongly influenced by the inclusion of the relatively high, but uncertain recruitment estimate for 2016.

- F indicates the geometric mean values of quarterly age-specific fishing mortality during 2002-2004.
- The Japanese unilateral measure (transferring 250 mt of catch upper limit from that for small PBF to that for large PBF during 2017-2020) would be reflected.
- Fishing mortality for the EPO commercial fishery was assumed to be high enough to fulfill its catch upper limit (F multiplied by two). The fishing mortality for the EPO recreational fishery was assumed to be the F2009-11 average level.
- In scenario 0, the future recruitment were assumed to be the low recruitment (1980-1989) level forever. In other scenarios, recruitment was switched from low recruitment to average recruitment from the next year of achieving the initial rebuilding target.

- In scenario 0, the future recruitment were assumed to be the low recruitment (1980-1989) level forever. In other scenarios, recruitment was switched from low recruitment to average recruitment from the next year of achieving the initial rebuilding target.

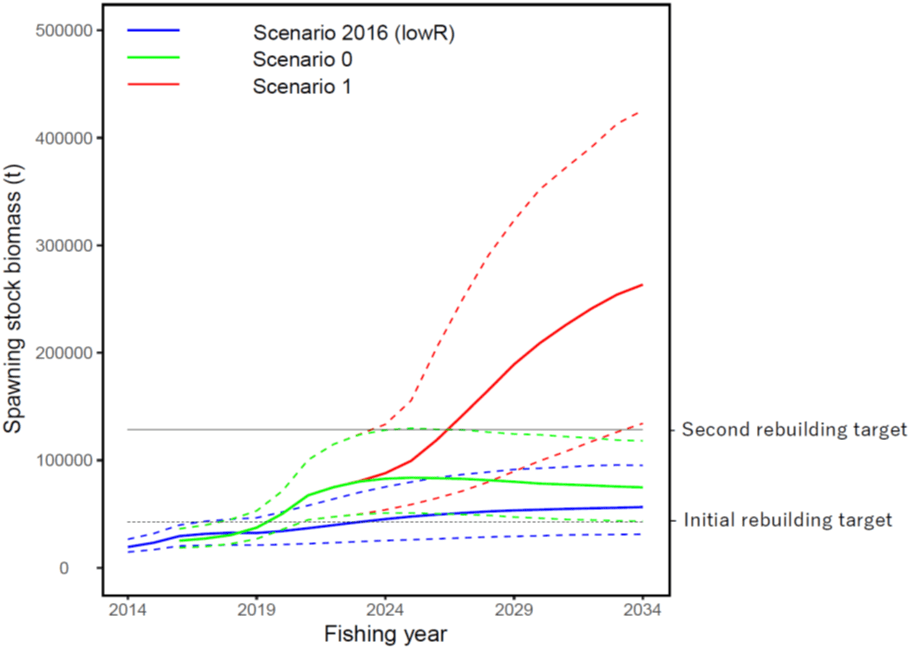
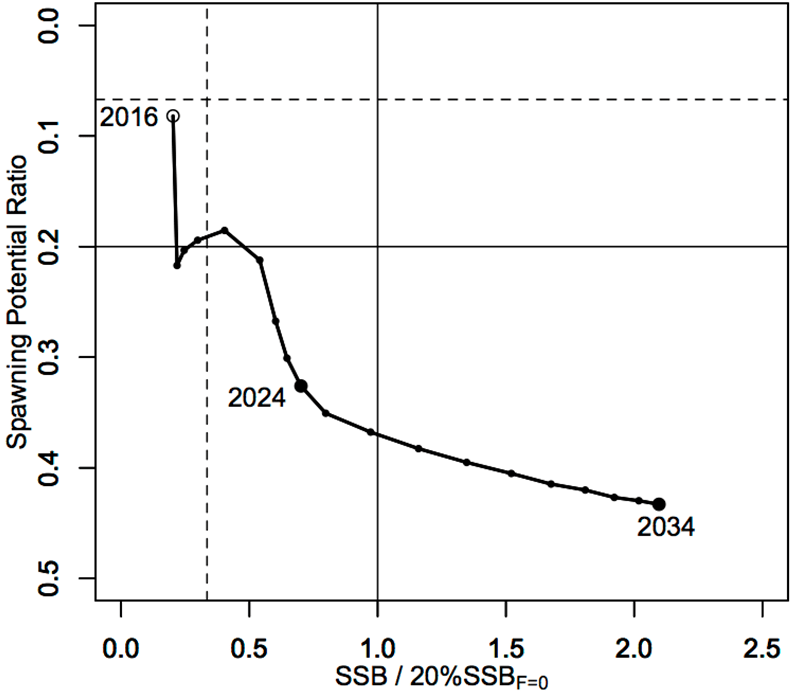
The Harvest Strategy adopted by WCPFC (Harvest Strategy 2017-02) guided projections conducted by ISC to provide catch reduction options if the projection results indicate that the initial rebuilding target will not be achieved or to provide relevant information for potential increase in catch if the probability of achieving the initial rebuilding target exceeds 75%. The projection results showed that the probability of achieving the initial rebuilding target was above the level (75% or above in 2024) prescribed in the WCPFC Harvest Strategy. Accordingly, the ISC examined some optional scenarios with higher catch limits, which can be found in Appendix 1 of the PBF 2018 stock assessment report (ISC/18/ANNEX/14).
Research Needs
Given the low SSB, the uncertainty in future recruitment, and the influence of recruitment on stock biomass, monitoring of recruitment and SSB should be strengthened so that the recruitment trends can be understood in a timely manner.