Stock Status and Conservation Information
(From ISC19 Plenary Report)
- Albacore
- Pacific Bluefin
- Blue Marlin
- Striped Marlin
- Swordfish
- Blue shark
- Shortfin mako
Western and Central North Pacific Striped Marlin
![]() Click here to see the ISC18 stock status and conservation information.
Click here to see the ISC18 stock status and conservation information.
Stock Status
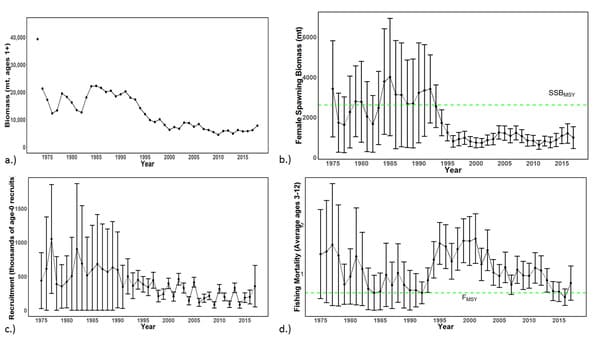
Biomass (age 1 and older) for the WCNPO MLS stock decreased from 17,000 t in 1975 to 6,000 t in 2017. Estimated fishing mortality averaged F=0.97 yr-1 during the 1975-1994 period with a range of 0.60 to 1.59 yr-1, peaked at F=1.71 year-1 in 2001, and declined sharply to F=0.64 yr-1 in the most recent years (2015-2017). Fishing mortality has fluctuated around FMSY since 2013. Compared to MSY-based reference points, the current spawning biomass (average for 2015-2017) was 76% below SSBMSY and the current fishing mortality (average for ages 3 E12 in 2015-2017) was 7% above FMSY.
Based on these findings, the following information on the status of the WCNPO MLS stock is provided:
- There are no established reference points for WCNPO MLS;
- Results from the base case assessment model show that under current conditions the WCNPO MLS stock is overfished and is subject to overfishing relative to MSYbased reference points (Table 1, Table 2, and Figure 1).
| Year | 2011 | 2012 | 2013 | 2014 | 2015 | 2016 | 20172 | Mean1 | Min1 | Max1 |
|---|---|---|---|---|---|---|---|---|---|---|
| Reported Catch | 2,690 | 2,757 | 2,534 | 1,879 | 2,072 | 1,892 | 2,487 | 5,643 | 1,879 | 10,862 |
| Population Biomass | 5,874 | 6,057 | 4,937 | 6,241 | 5,745 | 5,832 | 6,196 | 12,153 | 4,509 | 22,303 |
| Spawning Biomass | 618 | 809 | 743 | 864 | 1,073 | 1,185 | 981 | 1,765 | 618 | 3,999 |
| Relative Spawning Biomass |
0.24 | 0.31 | 0.29 | 0.33 | 0.41 | 0.46 | 0.38 | 0.68 | 0.24 | 1.54 |
| Recruitment(age0) | 196,590 | 87,956 | 330,550 | 77,274 | 185,438 | 195,069 | 354,391 | 396,218 | 77,274 | 1,049,460 |
| Fishing Mortality | 1.11 | 1.06 | 0.86 | 0.63 | 0.62 | 0.51 | 0.80 | 1.06 | 0.51 | 1.71 |
| Relative Fishing Mortality |
1.85 | 1.76 | 1.42 | 1.05 | 1.03 | 0.85 | 1.33 | 1.76 | 0.85 | 2.85 |
| Spawning Potential Ratio |
9% | 11% | 11% | 16% | 17% | 20% | 14% | 12% | 20% | 6% |
| Reference Point | Estimate |
|---|---|
| FMSY (age 3-12) | 0.60 |
| F2017(age 3-12) | 0.80 |
| F20%SSB(F=0) | 0.47 |
| SSBMSY | 2,604 t |
| SSB2017 | 981 t |
| 20%SSB0 | 3,610 t |
| MSY | 4,946 t |
| C2015-2017 | 2,151 t |
| SPRMSY | 18% |
| SPR2017 | 14% |
| SPR20%SSB(F=0) | 23% |
Conservation Information
The status of the WCNPO MLS stock shows evidence of substantial depletion of spawning potential (SSB2017 is 62% below SSBMSY), however fishing mortality has fluctuated around FMSY in the last four years. The WCNPO MLS stock has produced average annual yields of around 2,100 t per year since 2012, or about 40% of the MSY catch amount. However the majority of the catch are likely immature fish. All of the projections show an increasing trend in spawning stock biomass during the 2018-2020 period, with the exception of the high F scenario under the short-term recruitment scenario. This increasing trend in SSB is due to the 2017 year class, which is estimated from the stock-recruitment curve and is more than twice as large as recent average recruitment.
Based on these findings, the following conservation information is provided:
- Projection results under the long-term recruitment scenario show that the stock has at least a 60% probability of rebuilding to 20%SSB0, the rebuilding target specified by NC14, by 2022 for all harvest scenarios, with the exception of the highest F scenario (Average F 1975-1977);
- However, if the stock continues to experience recruitment consistent with the shortterm recruitment scenario (2012-2016), catches must be reduced to 60% of the WCPFC catch quota from CMM 2010-01 (3,397 t) to 1,359 t in order to achieve a 60% probability of rebuilding to by 2022. This corresponds to a reduction of roughly 37% from the recent average yield of 2,151 t;
- For the constant catch projection scenarios that were tested, it was notable that all of the projections under the long-term recruitment scenario would be expected to achieve the spawning biomass target by 2020 with probabilities ranging from 61% to 73% and corresponding catch quotas ranging from 3,397 to 1,359 t (Table 3).
| Year | 2018 | 2019 | 2020 | 2021 | 2022 | 2027 | 2037 | Year when target achieved with 60% probability |
|
|---|---|---|---|---|---|---|---|---|---|
| Scenario 1: Fstatus quo; Long-Term Recruitment | |||||||||
| SSB | 1931.3 | 2605.3 | 3591 | 4288.3 | 4639.4 | 4893.4 | 4884.4 | ||
| Catch | 2229.8 | 3089.8 | 3911.6 | 4412.8 | 4644.9 | 4797.2 | 4790.9 | ||
| Probability of reaching 20% SSB |
0% | 4% | 44% | 70% | 79% | 84% | 84% | 2021 | |
| Scenario 2: Fstatus quo; Short-Term Recruitment | |||||||||
| SSB | 1932.4 | 2556.5 | 3080 | 2786.9 | 2422.3 | 2071.4 | 2072.1 | ||
| Catch | 2224.6 | 2827 | 2871.7 | 2535.9 | 2260.7 | 2029.6 | 2030.4 | ||
| Probability of reaching 20% SSB |
0% | 4% | 21% | 9% | 2% | <0.5% | <0.5% | NA | |
| Scenario 3: FMSY; Long-Term Recruitment | |||||||||
| SSB | 1935.1 | 2611.8 | 3650.5 | 4444 | 4860.6 | 5158.9 | 5203.5 | ||
| Catch | 2228.1 | 3092.7 | 3705.2 | 4241.6 | 4498.9 | 4666.4 | 4711.5 | ||
| Probability of reaching 20% SSB |
0% | 4% | 47% | 75% | 83% | 89% | 89% | 2021 | |
| Scenario 4: FMSY; Short-Term Recruitment | |||||||||
| SSB | 1932.9 | 2557.7 | 3126.3 | 2895.5 | 2552.2 | 2207 | 2197 | ||
| Catch | 2230.8 | 2829.6 | 2724.6 | 2450.7 | 2209.9 | 1994.1 | 1984.9 | ||
| Probability of reaching 20% SSB |
0% | 4% | 23% | 12% | 4% | <0.5% | <0.5% | NA | |
| Scenario 5: F 20%SSBF=0; Long-Term Recruitment | |||||||||
| SSB | 1933.7 | 2611.9 | 3813.4 | 4943.7 | 5631 | 6358.1 | 6348.5 | ||
| Catch | 2227.6 | 3091.3 | 2996.4 | 3588.7 | 3933.2 | 4271.7 | 4266.7 | ||
| Probability of reaching 20% SSB |
0% | 4% | 55% | 85% | 93% | 97% | 98% | 2021 | |
| Scenario 6: F 20%SSBF=0; Short-Term Recruitment | |||||||||
| SSB | 1934 | 2560.5 | 3276.3 | 3274.8 | 3030.2 | 2697 | 2690.2 | ||
| Catch | 2224.9 | 2828.8 | 2211.6 | 2115.4 | 1969.7 | 1809.1 | 1804.7 | ||
| Probability of reaching 20% SSB |
0% | 4% | 29% | 28% | 17% | 6% | 7% | NA | |
| Scenario 7: Highest F (Average F 1975-1977); Long-Term Recruitment | |||||||||
| SSB | 1932.8 | 2611.8 | 2739.8 | 2299.1 | 2102 | 2028.4 | 2036.2 | ||
| Catch | 2226.4 | 3088.5 | 7520.7 | 6557.5 | 6184.4 | 6058 | 6084.1 | ||
| Probability of reaching 20% SSB |
0% | 4% | 9% | 4% | 2% | 1% | 1% | NA | |
| Scenario 8: Highest F (Average F 1975-1977); Short-Term Recruitment | |||||||||
| SSB | 1933.5 | 2559.4 | 2289.2 | 1330.7 | 968.3 | 858.7 | 859.2 | ||
| Catch | 2225.9 | 2827.6 | 5362.9 | 3399.3 | 2751.6 | 2564.6 | 2570.9 | ||
| Probability of reaching 20% SSB |
0% | 3% | 2% | <0.5% | 0% | 0% | 0% | NA | |
| Scenario 9: Low F (F30%); Long-Term Recruitment | |||||||||
| SSB | 1933.6 | 2612.5 | 4009.5 | 5603.2 | 6742.4 | 8287.5 | 8353 | ||
| Catch | 2228.6 | 3093.5 | 2117.6 | 2693.6 | 3075 | 3558.2 | 3577.8 | ||
| Probability of reaching 20% SSB |
0% | 4% | 63% | 93% | 98% | >99.5% | >99.5% | 2020 | |
| Scenario 10: Low F (F30%); Short-Term Recruitment | |||||||||
| SSB | 1932.5 | 2555.6 | 3453.8 | 3788.4 | 3747.4 | 3537.4 | 3525.3 | ||
| Catch | 2228.4 | 2832 | 1572.9 | 1623.8 | 1589 | 1515.8 | 1511.6 | ||
| Probability of reaching 20% SSB |
0% | 4% | 37% | 54% | 54% | 44% | 42% | NA | |
| Scenario 11: Current Quota; Long-Term Recruitment | |||||||||
| SSB | 1946.7 | 2823 | 4141.1 | 5220.9 | 6074.7 | 8147.5 | 8715.3 | ||
| Catch | 2150.6 | 2150.6 | 3396.8 | 3396.7 | 3396.3 | 3396.1 | 3396.8 | ||
| Probability of reaching 20% SSB |
<0.5% | 17% | 61% | 76% | 83% | 93% | 95% | 2020 | |
| Scenario 12: Current Quota; Short-Term Recruitment | |||||||||
| SSB | 1948.8 | 2737.1 | 3279.8 | 2592.9 | 1781.9 | 524.2 | 436.7 | ||
| Catch | 2150.6 | 2150.6 | 3393.7 | 3377.1 | 3319.7 | 2954.7 | 2903 | ||
| Probability of reaching 20% SSB |
<0.5% | 15% | 36% | 20% | 7% | <0.5% | <0.5% | NA | |
| Scenario 13: 10% Reduction; Long-Term Recruitment | |||||||||
| SSB | 1947.9 | 2826.1 | 4225.3 | 5467.3 | 6492.5 | 9096.5 | 9798.7 | ||
| Catch | 2150.6 | 2150.6 | 3057.1 | 3057.1 | 3056.8 | 3057.1 | 3057.1 | ||
| Probability of reaching 20% SSB |
<0.5% | 17% | 63% | 81% | 87% | 96% | 97% | 2020 | |
| Scenario 14: 10% Reduction; Short-Term Recruitment | |||||||||
| SSB | 1948.6 | 2738 | 3390.9 | 2886.8 | 2162.9 | 763 | 587 | ||
| Catch | 2150.6 | 2150.6 | 3054.6 | 3052.8 | 3032.5 | 2846.7 | 2780.1 | ||
| Probability of reaching 20% SSB |
<0.5% | 15% | 40% | 26% | 12% | <0.5% | <0.5% | NA | |
| Scenario 15: 20% Reduction; Long-Term Recruitment | |||||||||
| SSB | 1949.9 | 2829.1 | 4317.7 | 5750.4 | 6954.1 | 9928.4 | 10806.2 | ||
| Catch | 2150.6 | 2150.6 | 2717.4 | 2717.4 | 2717.4 | 2717.4 | 2717.4 | ||
| Probability of reaching 20% SSB |
<0.5% | 18% | 65% | 84% | 90% | 98% | 99% | 2020 | |
| Scenario 16: 20% Reduction; Short-Term Recruitment | |||||||||
| SSB | 1949.3 | 2739.2 | 3495.1 | 3176.4 | 2570.8 | 1175.5 | 883.3 | ||
| Catch | 2150.6 | 2150.6 | 2716.8 | 2714.3 | 2710.8 | 2648.8 | 2610.7 | ||
| Probability of reaching 20% SSB |
<0.5% | 15% | 43% | 34% | 19% | 1% | <0.5% | NA | |
| Scenario 17: 30% Reduction; Long-Term Recruitment | |||||||||
| SSB | 1947.6 | 2824.5 | 4381.5 | 5981.7 | 7356.2 | 10856.1 | 11783.5 | ||
| Catch | 2150.6 | 2150.6 | 2377.8 | 2377.8 | 2377.8 | 2377.8 | 2377.8 | ||
| Probability of reaching 20% SSB |
<0.5% | 17% | 67% | 87% | 94% | 99% | >99.5% | 2020 | |
| Scenario 18: 30% Reduction; Short-Term Recruitment | |||||||||
| SSB | 1947.4 | 2733.8 | 3594 | 3479.2 | 3018.1 | 1736.6 | 1383.5 | ||
| Catch | 2150.6 | 2150.6 | 2377.8 | 2377.1 | 2377.1 | 2365.6 | 2355.3 | ||
| Probability of reaching 20% SSB |
<0.5% | 15% | 45% | 42% | 29% | 5% | 2% | NA | |
| Scenario 19: 40% Reduction; Long-Term Recruitment | |||||||||
| SSB | 1949.2 | 2831.8 | 4486.8 | 6295.8 | 7868.9 | 11749.2 | 12851.3 | ||
| Catch | 2150.6 | 2150.6 | 2038.1 | 2038.1 | 2038.1 | 2038.1 | 2038.1 | ||
| Probability of reaching 20% SSB |
<0.5% | 18% | 70% | 90% | 95% | >99.5% | >99.5% | 2020 | |
| Scenario 20: 40% Reduction; Short-Term Recruitment | |||||||||
| SSB | 1949.9 | 2737.3 | 3689.5 | 3756 | 3445.9 | 2444.2 | 2124.2 | ||
| Catch | 2150.6 | 2150.6 | 2038.1 | 2038.1 | 2037.9 | 2037.6 | 2036.4 | ||
| Probability of reaching 20% SSB |
<0.5% | 15% | 48% | 49% | 41% | 16% | 10% | NA | |
| Scenario 21: 50% Reduction; Long-Term Recruitment | |||||||||
| SSB | 1950.4 | 2829.7 | 4548.9 | 6512.1 | 8259.1 | 12654 | 13799.3 | ||
| Catch | 2150.6 | 2150.6 | 1698.4 | 1698.4 | 1698.4 | 1698.4 | 1698.4 | ||
| Probability of reaching 20% SSB |
<0.5% | 17% | 71% | 92% | 97% | >99.5% | >99.5% | 2020 | |
| Scenario 22: 50% Reduction; Short-Term Recruitment | |||||||||
| SSB | 1949.1 | 2737.4 | 3791.4 | 4065.7 | 3916.3 | 3214.4 | 3021.3 | ||
| Catch | 2150.6 | 2150.6 | 1698.4 | 1698.4 | 1698.4 | 1698.4 | 1698.4 | ||
| Probability of reaching 20% SSB |
<0.5% | 15% | 51% | 57% | 53% | 35% | 29% | NA | |
| Scenario 23: 60% Reduction; Long-Term Recruitment | |||||||||
| SSB | 1949.9 | 2829.1 | 4631.3 | 6798.1 | 8741.1 | 13605.2 | 14857.1 | ||
| Catch | 2150.6 | 2150.6 | 1358.7 | 1358.7 | 1358.7 | 1358.7 | 1358.7 | ||
| Probability of reaching 20% SSB |
<0.5% | 18% | 73% | 94% | 98% | >99.5% | >99.5% | 2020 | |
| Scenario 24: 60% Reduction; Short-Term Recruitment | |||||||||
| SSB | 1948.6 | 2737.7 | 3888.1 | 4364.3 | 4396.6 | 4110.1 | 3970.5 | ||
| Catch | 2150.6 | 2150.6 | 1358.7 | 1358.7 | 1358.7 | 1358.7 | 1358.7 | ||
| Probability of reaching 20% SSB |
<0.5% | 15% | 53% | 65% | 67% | 63% | 59% | 2021* | |
| Scenario 25: 70% Reduction; Short-Term Recruitment | |||||||||
| SSB | 1948.7 | 2736.4 | 3979.8 | 4667.7 | 4886 | 4960.9 | 4977 | ||
| Catch | 2150.6 | 2150.6 | 1019 | 1019 | 1019 | 1019 | 1019 | ||
| Probability of reaching 20% SSB |
<0.5% | 15% | 56% | 72% | 78% | 85% | 86% | 2021 | |
| Scenario 26: 80% Reduction; Short-Term Recruitment | |||||||||
| SSB | 1948.7 | 2736.2 | 4071.1 | 4971.3 | 5380.3 | 5909.1 | 5977.5 | ||
| Catch | 2150.6 | 2150.6 | 679.4 | 679.4 | 679.4 | 679.4 | 679.4 | ||
| Probability of reaching 20% SSB |
<0.5% | 15% | 58% | 79% | 88% | 97% | 97% | 2021 | |
| Scenario 27: 90% Reduction; Short-Term Recruitment | |||||||||
| SSB | 1950.6 | 2740.5 | 4170.3 | 5284.1 | 5881.7 | 6836.7 | 7009.4 | ||
| Catch | 2150.6 | 2150.6 | 339.7 | 339.7 | 339.7 | 339.7 | 339.7 | ||
| Probability of reaching 20% SSB |
<0.5% | 15% | 61% | 85% | 94% | >99.5% | >99.5% | 2020 | |
It was also noted that retrospective analyses show that the assessment model appears to overestimate spawning potential in recent years, which may mean the projection results are ecologically optimistic.
Special Comments
The WG achieved a base-case model using the best available data and biological information. However, the WG recognized uncertainty in some assessment inputs including drift gillnet catches and initial catch amounts, life history parameters such as maturation and growth, and stock structure.
Overall, the base case model diagnostics and sensitivity runs show that that there are some conflicts in the data (ISC/19/ANNEX/11). When developing a conservation and management measure to rebuild the resource, it is recommended that these issues be recognized and carefully considered, because they affect the perceived stock status and the probabilities and time frame for rebuilding of the WCNPO MLS stock.
Research Needs
To improve the stock assessment, the WG recommends continuing model development work, to reduce data conflicts and modeling uncertainties, and reevaluating and improving input assessment data.