Stock Status and Conservation Information
(From ISC18 Plenary Report)
Western and Central North Pacific Swordfish
Stock Status
Estimates of total stock biomass show a relatively stable population, with a slight decline until the mid-1990s followed by a slight increase since 2000. Population biomass (age-1 and older) averaged roughly 97,919 t in 1974-1978, the first 5 years of the assessment time frame, and has declined by only 20% to 71,979 t in 2016 (Figure 1). Female spawning stock biomass was estimated to be 29,403 t in 2016, or about 90% above SSBMSY (Table 1 and Table 2). Fishing mortality on the stock (average F, ages 1 E10) averaged roughly F = 0.08 yr-1 during 2013-2015, or about 45% below FMSY. The estimated SPR (the predicted spawning output at the current F as a fraction of unfished spawning output) is currently SPR2016 = 45%. Annual recruitment averaged about 717,000 recruits during 2012-2016, and no long-term trend in recruitment was apparent. Overall, the time series of spawning stock biomass and recruitment estimates indicate a stable spawning stock biomass and suggest a fluctuating pattern without trend for recruitment (Figure 1). The Kobe plot depicts the stock status relative to MSY-based reference points for the base case model (Figure 2) and shows that spawning stock biomass declined to almost the MSY level in the mid-1990s, but SSB has remained above SSBMSY throughout the time series (Figure 1B).
For this 2018 benchmark assessment, note that biomass status is based on female spawning stock biomass, whereas for the 2014 update assessment, biomass status was based on exploitable biomass (effectively age-2+ biomass). It is also important to note that there are no currently agreed upon reference points for the WCNPO swordfish stock and that retrospective analyses show that the assessment model appears to underestimate spawning stock biomass in recent years.
Based on these findings, the following information on the status of the WCNPO SWO stock is provided:
- The WCNPO swordfish stock has produced annual yields of around 10,200 t per year since 2012, or about 2/3 of the MSY catch amount.
- There is no evidence of excess fishing mortality above FMSY (F2013-2015 is 45% of FMSY) or substantial depletion of spawning potential (SSB2016 is 87% above SSBMSY).
- Overall, the WCNPO swordfish stock is not likely overfished and is not likely experiencing overfishing relative to MSY-based or 20% of unfished spawning biomass-based reference points.
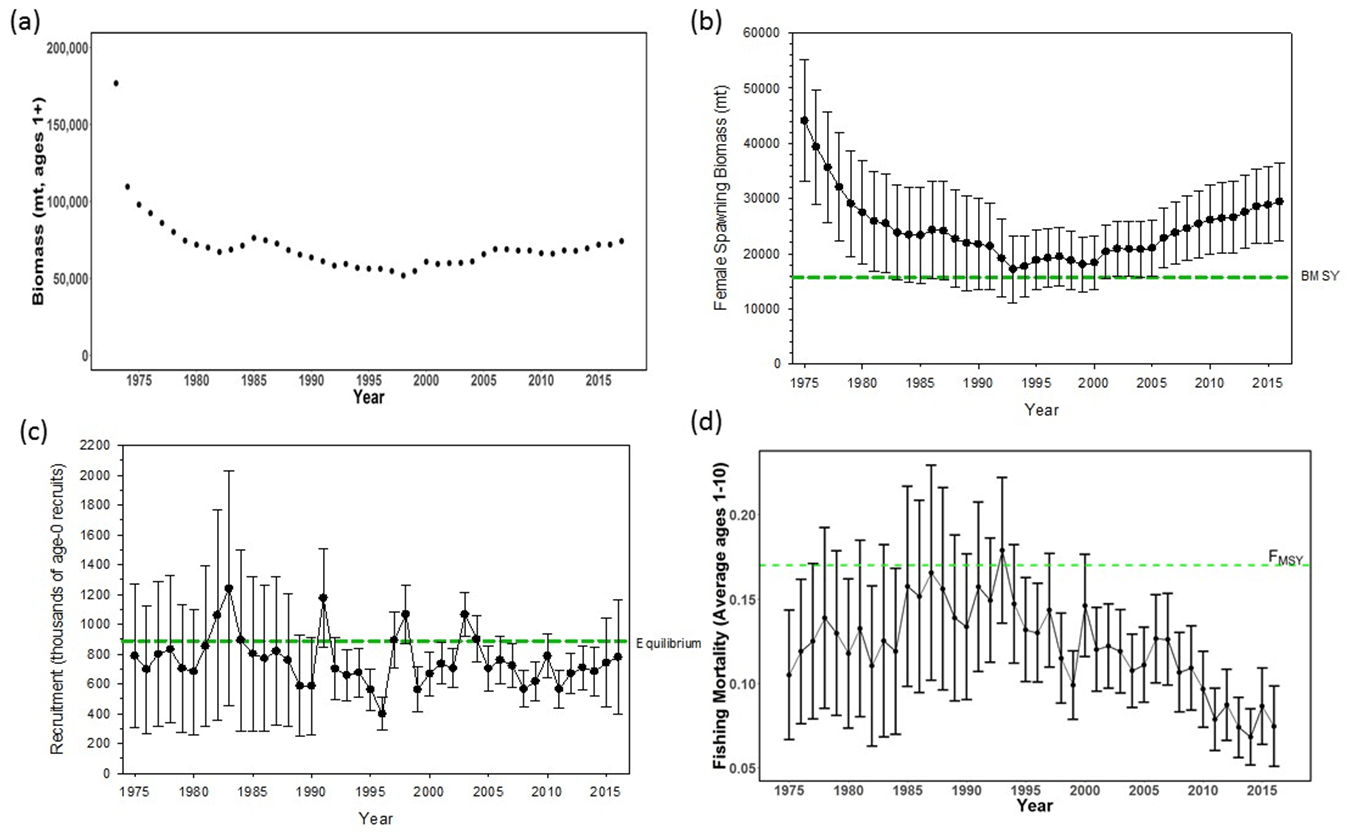
- (a) population biomass (age 1+) (first point in time series represents unfished biomass),
- (b) spawning biomass,
- (c) recruitment (age-0 fish), and
- (d) instantaneous fishing mortality (average for ages 1 to 10, yr-1)
The solid circles are the maximum likelihood estimates by year for each quantity and the error bars represent the uncertainty of the estimates (80% confidence intervals), green dashed lines indicate BMSY, equilibrium recruitment, and FMSY except for the population biomass time series.
| Year | 2010 | 2011 | 2012 | 2013 | 2014 | 2015 | 2016 | Mean1 | Min1 | Max1 |
|---|---|---|---|---|---|---|---|---|---|---|
| Reported Catch | 12,716 | 9,971 | 10,608 | 9,241 | 9,211 | 11,672 | 10,068 | 12,863 | 9,211 | 17,793 |
| Population Biomass | 66,417 | 66,087 | 68,117 | 67,885 | 69,560 | 71,951 | 71,979 | 67,487 | 51,856 | 97,919 |
| Spawning Biomass | 26,136 | 26,448 | 26,569 | 27,546 | 28,580 | 28,865 | 29,404 | 24,442 | 17,191 | 44,100 |
| Relative Spawning Biomass |
1.66 | 1.68 | 1.69 | 1.75 | 1.82 | 1.84 | 1.87 | 1.56 | 1.09 | 2.81 |
| Recruitment (age 0) | 789 | 565 | 671 | 710 | 683 | 742 | 781 | 761 | 401 | 1241 |
| Fishing Mortality | 0.10 | 0.08 | 0.09 | 0.07 | 0.07 | 0.09 | 0.07 | 0.12 | 0.07 | 0.18 |
| Relative Fishing Mortality |
0.57 | 0.46 | 0.51 | 0.44 | 0.40 | 0.51 | 0.44 | 0.72 | 0.40 | 1.05 |
| Spawning Potential Ratio |
38% | 41% | 39% | 45% | 47% | 39% | 45% | 29% | 17% | 47% |
| Reference Point | Estimate |
|---|---|
| FMSY | 0.17 yr-1 |
| F0.2*SSB(F=0) | 0.16 yr-1 |
| F2013-2015 | 0.08 yr-1 |
| SSBMSY | 15,702 mt |
| SSB2016 | 29,403 mt |
| SSBF=0 | 97,286 mt |
| MSY | 14,941 mt |
| C2012-2016 | 10,160 mt |
| SPRMSY | 18% |
| SPR2016 | 45% |

Conservation Information
Stock projections were conducted using a two-gender projection model. The five stock projection scenarios were: (1) F status quo, (2) FMSY, (3) F at 0.2*SSB(F=0), (4) F20%, and (5) F50% (Figure 3). These projection scenarios were applied to the base case model results to evaluate the impact of alternative levels of fishing intensity on future spawning biomass and yield for swordfish in the Western and Central North Pacific Ocean. The projected recruitment pattern was generated by stochastically sampling the estimated stock-recruitment model from the base case model. The projection calculations employed model estimates for the multi-fleet, multi-season, size- and age-selectivity, and structural complexity in the assessment model to produce consistent results.
Based on these findings, the following conservation information is provided:
- The results show that projected female spawning biomasses is expected to increase under all of the harvest scenarios (Table 3 and Figure 3), with greater increases expected under lower fishing mortality rates.
- Similarly, projected catch is expected to increase under each of the five harvest scenarios, with greater increases expected under higher fishing mortality rates (Table 3 and Figure 3).

- (a) spawning stock biomass and
- (b) total catch from the WCNPO swordfish base case model.
- S1 = the status quo or average fishing intensity during 2013-2015 (F2013∁E015= F43%);
- S2 = FMSY (F18%);
- S3 = F to produce 20% of unfished spawning stock biomass or F0.2*SSB(F=0) (F22%);
- S4 = the highest 3-year average F during 1975-2016 or High F (F20%);
- S5 = Low F (F50%).
| Year | 2017 | 2018 | 2019 | 2020 | 2021 | 2022 | 2023 | 2024 | 2025 | 2026 |
|---|---|---|---|---|---|---|---|---|---|---|
| Scenario 1: F = F2013-2015 | ||||||||||
| SSB | 32,118 | 33,207 | 34,599 | 35,476 | 36,270 | 37,082 | 37,951 | 38,967 | 40,083 | 41,087 |
| Catch | 8,851 | 9,135 | 9,407 | 9,599 | 9,794 | 10,022 | 10,275 | 10,595 | 11,053 | 11,142 |
| Scenario 2: F = FMSY | ||||||||||
| SSB | 28,267 | 23,963 | 21,443 | 19,458 | 18,303 | 17,618 | 17,293 | 17,197 | 17,253 | 17,263 |
| catch | 20,885 | 18,323 | 16,509 | 15,294 | 14,666 | 14,353 | 14,308 | 14,520 | 14,650 | 14,348 |
| Scenario 3: F = F20%SSB(F=0) | ||||||||||
| SSB | 28,425 | 24,384 | 21,800 | 19,735 | 18,530 | 17,874 | 17,496 | 17,586 | 17,818 | 17,779 |
| Catch | 20,691 | 18,122 | 16,454 | 15,261 | 14,653 | 14,361 | 14,319 | 14,554 | 14,665 | 14,384 |
| Scenario 4: F = F20% | ||||||||||
| SSB | 29,007 | 25,431 | 23,527 | 21,763 | 20,736 | 20,131 | 19,893 | 19,883 | 19,981 | 20,066 |
| Catch | 18,680 | 16,933 | 15,657 | 14,726 | 14,242 | 14,033 | 14,050 | 14,292 | 14,496 | 14,253 |
| Scenario 5: F = F50% | ||||||||||
| SSB | 32,559 | 34,334 | 36,290 | 37,666 | 38,836 | 39,984 | 41,148 | 42,490 | 44,049 | 45,625 |
| Catch | 7,556 | 7,973 | 8,343 | 8,605 | 8,847 | 9,101 | 9,366 | 9,692 | 10,087 | 10,223 |
Research Needs
The lack of sex-specific size composition data and the simplified treatment of the spatial structure of swordfish population dynamics remained as two important sources of uncertainty for this benchmark assessment.


Eastern Pacific Ocean Swordfish
Stock Status
For the EPO stock, exploitable biomass had a declining trend during 1969-1995 and increased from 31,000 t in 1995 to over 60,000 t in 2010, generally remaining above BMSY (exploitable biomass, age-2+). Harvest rates were initially low, have had a long-term increasing trend, and likely exceeded HMSY in 1998, 2002, 2003, as well as in 2012, the terminal year of the stock assessment.
Based on these findings, the following information on the status of the EPO SWO stock is provided:
- No target or limit reference points have been established for the EPO swordfish stock under the auspices of the IATTC
- The Kobe plot shows that overfishing likely occurred (>50%) in a few years relative to MSY-based reference points, but may have occurred (<50%) from 2010 to 2012.
- There was a 55% probability that overfishing occurred in 2012, but there was a less than 1% probability that the stock was overfished relative to MSY-based reference points.
Conservation Information
Stochastic projections for the EPO stock show that exploitable biomass will likely have a decreasing trajectory during 2014-2016 under the eight harvest scenarios examined. Under the high harvest rate scenarios (status quo catch, maximum observed harvest rate, 150% of HMSY), exploitable biomass was projected to decline to 31,170 t (BMSY) by 2016 with corresponding harvest rates above HMSY. In comparison, under the status quo harvest rate scenario, exploitable biomass was projected to decline to only 40,000 t by 2016, well above the BMSY level. Overall, the projections showed that if recent high catch levels (9,700 t) persist, exploitable biomass will decrease and a moderate risk (50%) of overfishing will continue to occur.
The risk analyses for harvesting a constant catch of EPO SWO during 2014-2016 showed that the probabilities of overfishing and becoming overfished increased as projected catch increased in the future. Maintaining the current (2010-2012) catch of EPO SWO of approximately 9,700 t would lead to a 50% probability of overfishing in 2016 and a less than 1% probability of the stock being overfished in 2016.
Based on these findings, the following conservation information is provided:
- For the EPO SWO stock, overfishing may have occurred (<50%) from 2010 to 2012, and the average yield of roughly 10,000 t in those years, or almost two times higher than the estimated MSY, is not likely to be sustainable in the long term.
- While biomass of the EPO stock appears to be nearly twice BMSY, any increases in catch above recent (3-year average 2010-2012) levels should consider the uncertainty in stock structure and unreported catch.