Stock Status and Conservation Advice
(From ISC16 Plenary Report)
- Albacore
- Pacific Bluefin
- Blue Marlin
- Striped Marlin
- Swordfish
- Blue shark
- Shortfin mako
Striped Marlin
Stock Status
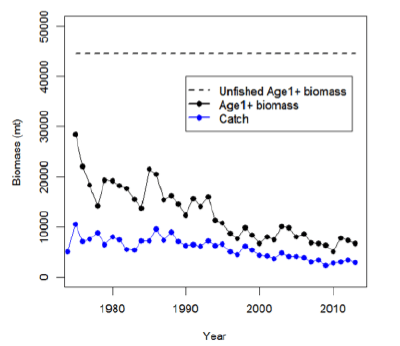
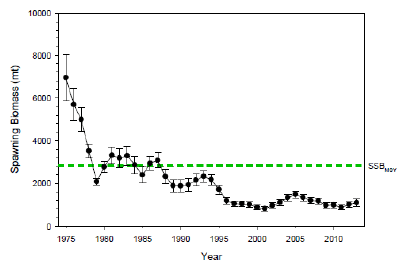
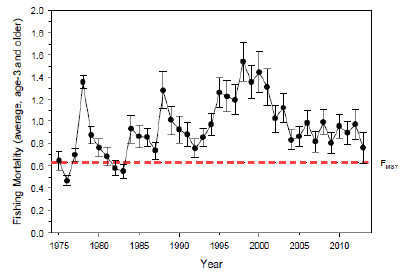
Estimates of population biomass of the WCNPO Striped Marlin (MLS) exhibit a long-term decline (Figure 1 and Figure 2). Population biomass (age-1 and older) averaged roughly 20,513 t, or 46% of unfished biomass during 1975-1979, the first 5 years of the assessment time frame, and declined to 6,819 t, or 15% of unfished biomass in 2013. Spawning stock biomass is estimated to be 1,094 t in 2013 (39% of SSBMSY, the spawning stock biomass to produce MSY, Figure 2). Fishing mortality on the stock (average F on ages 3 and older) is currently high (Figure 3) and averaged roughly F = 0.94 during 2010-2012, or 49% above FMSY. The predicted value of the spawning potential ratio (SPR, the predicted spawning output at current F as a fraction of unfished spawning output) is currently SPR2010-2012 = 12% ,which is 33% below the level of SPR required to produce MSY. Recruitment averaged about 308,000 recruits during 1994-2011, which was 25% below the 1975-2013 average. No target or limit reference points have been established for the WCNPO striped marlin stock under the auspices of the WCPFC.
The WCNPO MLS stock is expected to be highly productive due to its rapid growth and high resilience to reductions in spawning potential. The status of the stock is highly dependent on the magnitude of recruitment, which has been below its long-term average since 2007, with the exception of 2010. Changes in recent size composition data in comparison to the previous assessment resulted in changes in fishery selectivity estimates and also affected recruitment estimates. This, in turn, affected the scaling of biomass and fishing mortality to reference levels.
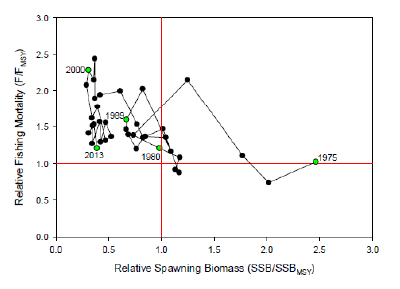
When the status of MLS is evaluated relative to MSY-based reference points, the 2013 spawning stock biomass is 61% below SSBMSY (2819 t) and the 2010-2012 fishing mortality exceeds FMSY by 49% (Figure 4). Therefore, overfishing is occurring relative to MSY-based reference points and the WCNPO MLS stock is overfished.
Conservation Advice
The stock has been experiencing overfishing since 1977, with the exception of 1982 and 1983, and fishing appears to be impeding rebuilding especially if recent (2007-2011) low recruitment levels persist. Projection results show that fishing at FMSY could lead to median spawning biomass increases of 25%, 55%, and 95% from 2015 to 2020 under the recent recruitment, medium-term recruitment, and stock recruitment-curve scenarios. Fishing at a constant catch of 2,850 t could lead to potential increases in spawning biomass of 19% to over 191% by 2020, depending upon the recruitment scenario. In comparison, fishing at the 2010-2012 fishing mortality rate, which is 49% above FMSY, could lead to changes in spawning stock biomass of -18% to +18% by 2020, while fishing at the average 2001-2003 fishing mortality rate (F2001-2003=1.15), which is 82% above FMSY, could lead to spawning stock biomass decreases of -32% to -9% by 2020, depending upon the recruitment scenario.