- Home
- list of historical archives
- ISC13 Stock status
Stock Status and Conservation Advice
(From ISC13 Plenary Report)
North Pacific Albacore
Stock Status
Although there is uncertainty in the absolute estimates of biomass (total and SSB) and fishing mortality, the stock status and conservation advice based on the FSSB-ATHL reference point are relatively insensitive to these uncertainties as trends in SSB and recruitment are robust to the different plausible assumptions tested. Estimates of F2006-2008 (current F) expressed as a ratio relative to several potential F-based reference points (FMAX, F0.1, FMED, F20-50%) are less than 1.0 and SSB is currently around the long-term median of the stock and is expected to fluctuate around the historical median SSB in the future assuming constant F2006-2008 and average historical recruitment. The ratio F2006-2008/FSSB-ATHL is 0.71, which means current F is well below the fishing mortality that would lead SSB to fall below the SSB- ATHL threshold. Thus the stock in not experiencing overfishing and the stock is not in an overfished condition, (e.g., F20-50% < 1.0), although biomass-based reference points have not been established for this stock.
Conservation Advice
The Albacore Working Group (ALBWG) noted that it has not received any new information since the 2011 stock assessment that would require a change to previous (2011) conservation information. Therefore, the ALBWG offers no new recommendations on conservation above, beyond that provided by ISC11:
- The stock is considered to be healthy at average historical recruitment levels and fishing mortality (F2006-2008).
- Sustainability is not threatened by overfishing as the F2006-2008level (current F) is about 71% of FSSB-ATHL and the stock is expected to fluctuate around the long-term median SSB (~400,000 t) in the short- and long-term future.
- If future recruitment declines by about 25% below average historical recruitment levels, then the risk of SSB falling below the SSB-ATHL threshold with F2006-2008 levels increases to 54% indicating that the impact on the stock is unlikely to be sustainable.
- Increasing F beyond F2006-2008 levels (current F) will not result in proportional increases in yield as a result of the population dynamics of this stock.
- The current assessment results confirm that F has declined relative to the 2006 assessment, which is consistent with the intent of the previous (2006) WG recommendation.
Pacific Bluefin Tuna
Stock Status
Overfishing is occurring and the stock is heavily overfished. Current spawning stock biomass is near their lowest level (3.6%) and has been declining for over a decade. Although no target or limit reference points have been established for PBF, the current F (average 2007-2009) is above all reasonable target and limit biological reference points (BRPs). Since reference points have not been identified for PBF by the WCPFC-NC, two Kobe plots based on alternative choices for reference points are provided (Figure 1). Caveats accompany the interpretation of these plots, which is delineated in the full stock assessment report.
Citation of these plots without appropriate interpretation may be misleading since our understanding of PBF population dynamics is incomplete. Plot A has a stock trajectory that is consistent with expectations that the stock was in a healthy condition early in the time series. However, plot B indicates overexploitation throughout the assessment (1952-2010) period. There is no plausible explanation why there was overexploitation at the beginning of the time-series (1952). If PBF productivity was strongly environmentally driven, the state of the stock may be hard to represent via a Kobe plot.
Fishery impact analysis (1970-2010) suggests that historically, the Japan coastal fishery group has had the greatest impact (i.e., expected spawning stock biomass) on the PBF stock; since about 1999 the impact of the WPO purse seine fleet has increased, and the effect of this fleet is currently greater than any of the other fishery groups. The impact of EPO fisheries was large before the mid-1980s, decreasing after the 1990s. The WPO longline fleet has had a limited effect on the stock throughout the analysis period.
Based on 2012 data, (1) reported catches of juveniles and adults in WPO fisheries declined, (2) decreased catch in the troll fishery were observed and may suggest declining recruitment, and (3) Japanese longline CPUE continued to decline. Potential risk to the spawning stock may be higher than previously thought. Under low recruitment levels, the risk of SSB falling below the historically lowest SSB level will increase under current (F2007-2009) harvesting levels.
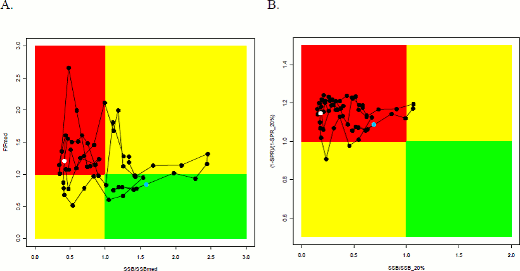
A. SSBMED and FMED; B. SSB20% and SPR20%.
Conservation Advice
The current (2010) PBF biomass level is near historically low levels and experiencing high exploitation rates above all biological reference points (BRPs) commonly used by fisheries managers. Based on projection results, extending the status quo (2007-2009) fishing levels is unlikely to improve stock status. Continued monitoring of abundance indices is recommended to track SSB.
Preliminary WPO data indicate an unusually low catch of age-0 PBF in 2012; this may imply low recruitment, which would adversely affect projected stock rebuilding and increase the risk of SSB falling below its historical lowest level observed. Further reduction of fishing mortality, especially for juvenile fish, is needed to reduce the risk of SSB falling below its historically lowest level.
Strengthening the monitoring of recruitment is highly recommended to comprehend the trend of recruitment in a timely manner.
Pacific Blue Marlin
Stock Status
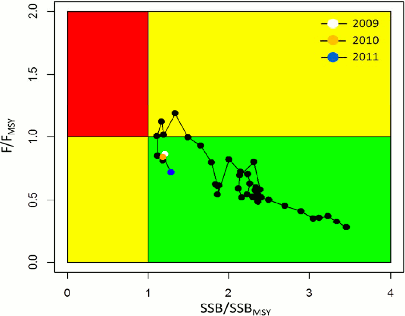
Estimates of total stock biomass show a long-term gradual decline from 1971-2005. In contrast, recruitment fluctuated without trend over the same period. The base case assessment model indicates spawning stock biomass decreased to the MSY level in the mid-2000s, and since has increased. The predicted value of the spawning potential ratio (SPR, the predicted spawning output at current F as a fraction of unfished spawning output) is currently SPR2009-2011 = 23%. The stock is currently not overfished and is not subject to overfishing relative to MSY-based reference points (Figure 2).
Conservation Advice
The stock is not currently overfished and is not experiencing overfishing. The stock is fully exploited. Stock biomass has declined since the 1970s and has been stable since the mid-2000s, with a slight recent increase. Fishing mortality should not be increased from the 2009-2011 level to avoid overfishing.
North Pacific Striped Marlin
Stock Status
Female spawning biomass is currently low and averaged roughly 1,518 mt during 2007-2009 (56% of SBMSY, the female spawning biomass to produce MSY). Fishing mortality on the stock (average F on ages 3 and older) is currently high and averaged roughly F = 0.76 during 2007-2009 (24% above FMSY). Recruitment averaged about 328,000 recruits during 1994-2008, which was roughly 30% below the 1975-2010 average. Compared to MSY-based reference points, the current (average during 2007-2009) spawning biomass is 44% below SBMSY and the current fishing mortality exceeds FMSY by 24%. Therefore, overfishing is currently occurring relative to MSY and the stock is in a depleted state (Figure 3).
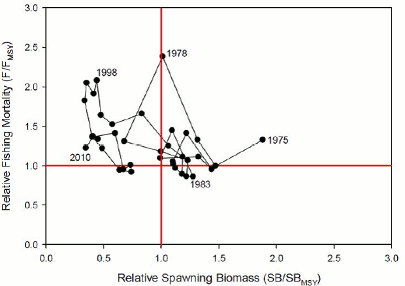
Kobe plot, 1975-2012.
Conservation Advice
Reducing fishing mortality would likely increase spawning stock biomass and would improve the chances of higher recruitment. Based on new projection results, fishing at FMSY would lead to a spawning biomass decrease of about 8% in 2017 under recent average recruitment. In contrast if recruitment improves to the medium or long- term average patterns, increases of roughly 45% to 73% may occur.
North Pacific Blue Shark
Stock Status
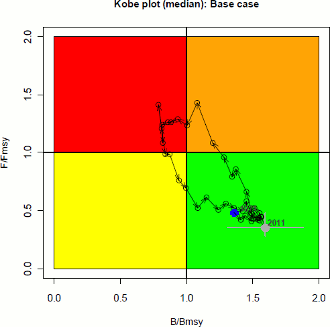
Based on the base case and most alternative model scenarios, the blue shark biomass level in 2011 in the North Pacific is estimated to be near the highest levels seen in the time series, and the current fishing mortality rates and catch levels are below those expected to produce MSY. Stock status in relation to maximum sustainable yield (MSY) demonstrates that the stock is not overfished and that overfishing is not occurring (Figure 4).
A single scenario using CPUE data for the Hawaii-based deep longline fleet for 1995-2011 in place of the Japan shallow longline index for 1994-2010 showed a continual decline in stock biomass from 1971 to 2011, which could lead to a different conclusion regarding stock status. The Hawaii index was not considered to be representative of the Pacific-wide stock due to the relatively small amount of catch, limited spatial coverage, and the potential impact of regulatory changes in the fishery.
Conservation Advice
Based on the base-case and most alternative model scenarios, the North Pacific blue shark stock is not overfished and overfishing is not occurring. Future projections of the base case model show that median blue shark biomass in the North Pacific will remain above BMSY under the catch harvest policies examined (status quo, +20%, -20%). Similarly, future projections under different fishing mortality (F) harvest policies (status quo, +20%, -20%) show that median blue shark biomass in the North Pacific will remain above BMSY.
North Pacific Swordfish
Stock Status
Stock projections from 2007-2012 based on Western Central North Pacific Ocean swordfish catch through 2012 show that the stock is not likely to be overfished and is not likely to be experiencing overfishing (Figure 5).
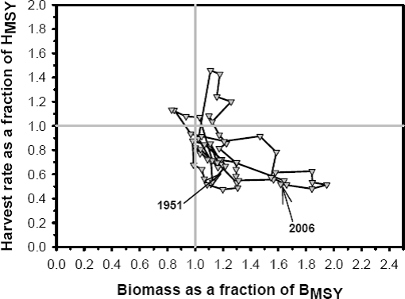
as a fraction of HMSY(1952 E2006).
Conservation Advice
The WCPO swordfish stock is healthy and is above the level required to sustain recent catches.