Stock Status and Conservation Information
(From ISC24 Plenary Report)
- Albacore
- Pacific Bluefin
- Blue Marlin
- Striped Marlin
- Swordfish
- Blue shark
- Shortfin mako
Shortfin Mako Shark
![]() Click here to see the ISC23 stock status and conservation information.
Click here to see the ISC23 stock status and conservation information.
Stock Status
The current assessment provides the best scientific information available on North Pacific shortfin mako shark (SMA) stock status. Results from this assessment should be considered with respect to the management objectives of the WCPFC and the IATTC, the organizations responsible for management of pelagic sharks caught in international fisheries for tuna and tuna-like species in the Pacific Ocean. Target and limit reference points have not been established for pelagic sharks in the Pacific Ocean. In this assessment, stock status is reported in relation to maximum sustainable yield (MSY).
A BSPM ensemble was used for this assessment; therefore, the reproductive capacity of this population was characterized using total depletion (D) rather than spawning abundance as in the previous assessment. Total depletion is the total number of SMA divided by the unfished total number (i.e., carrying capacity). Recent D (D2019-2022) was defined as the average depletion over the period 2019-2022. Exploitation rate (U) was used to describe the impact of fishing on this stock. The exploitation rate is the proportion of the SMA population that is removed by fishing. Recent U (U2018-2021) is defined as the average U over the period 2018-2021.
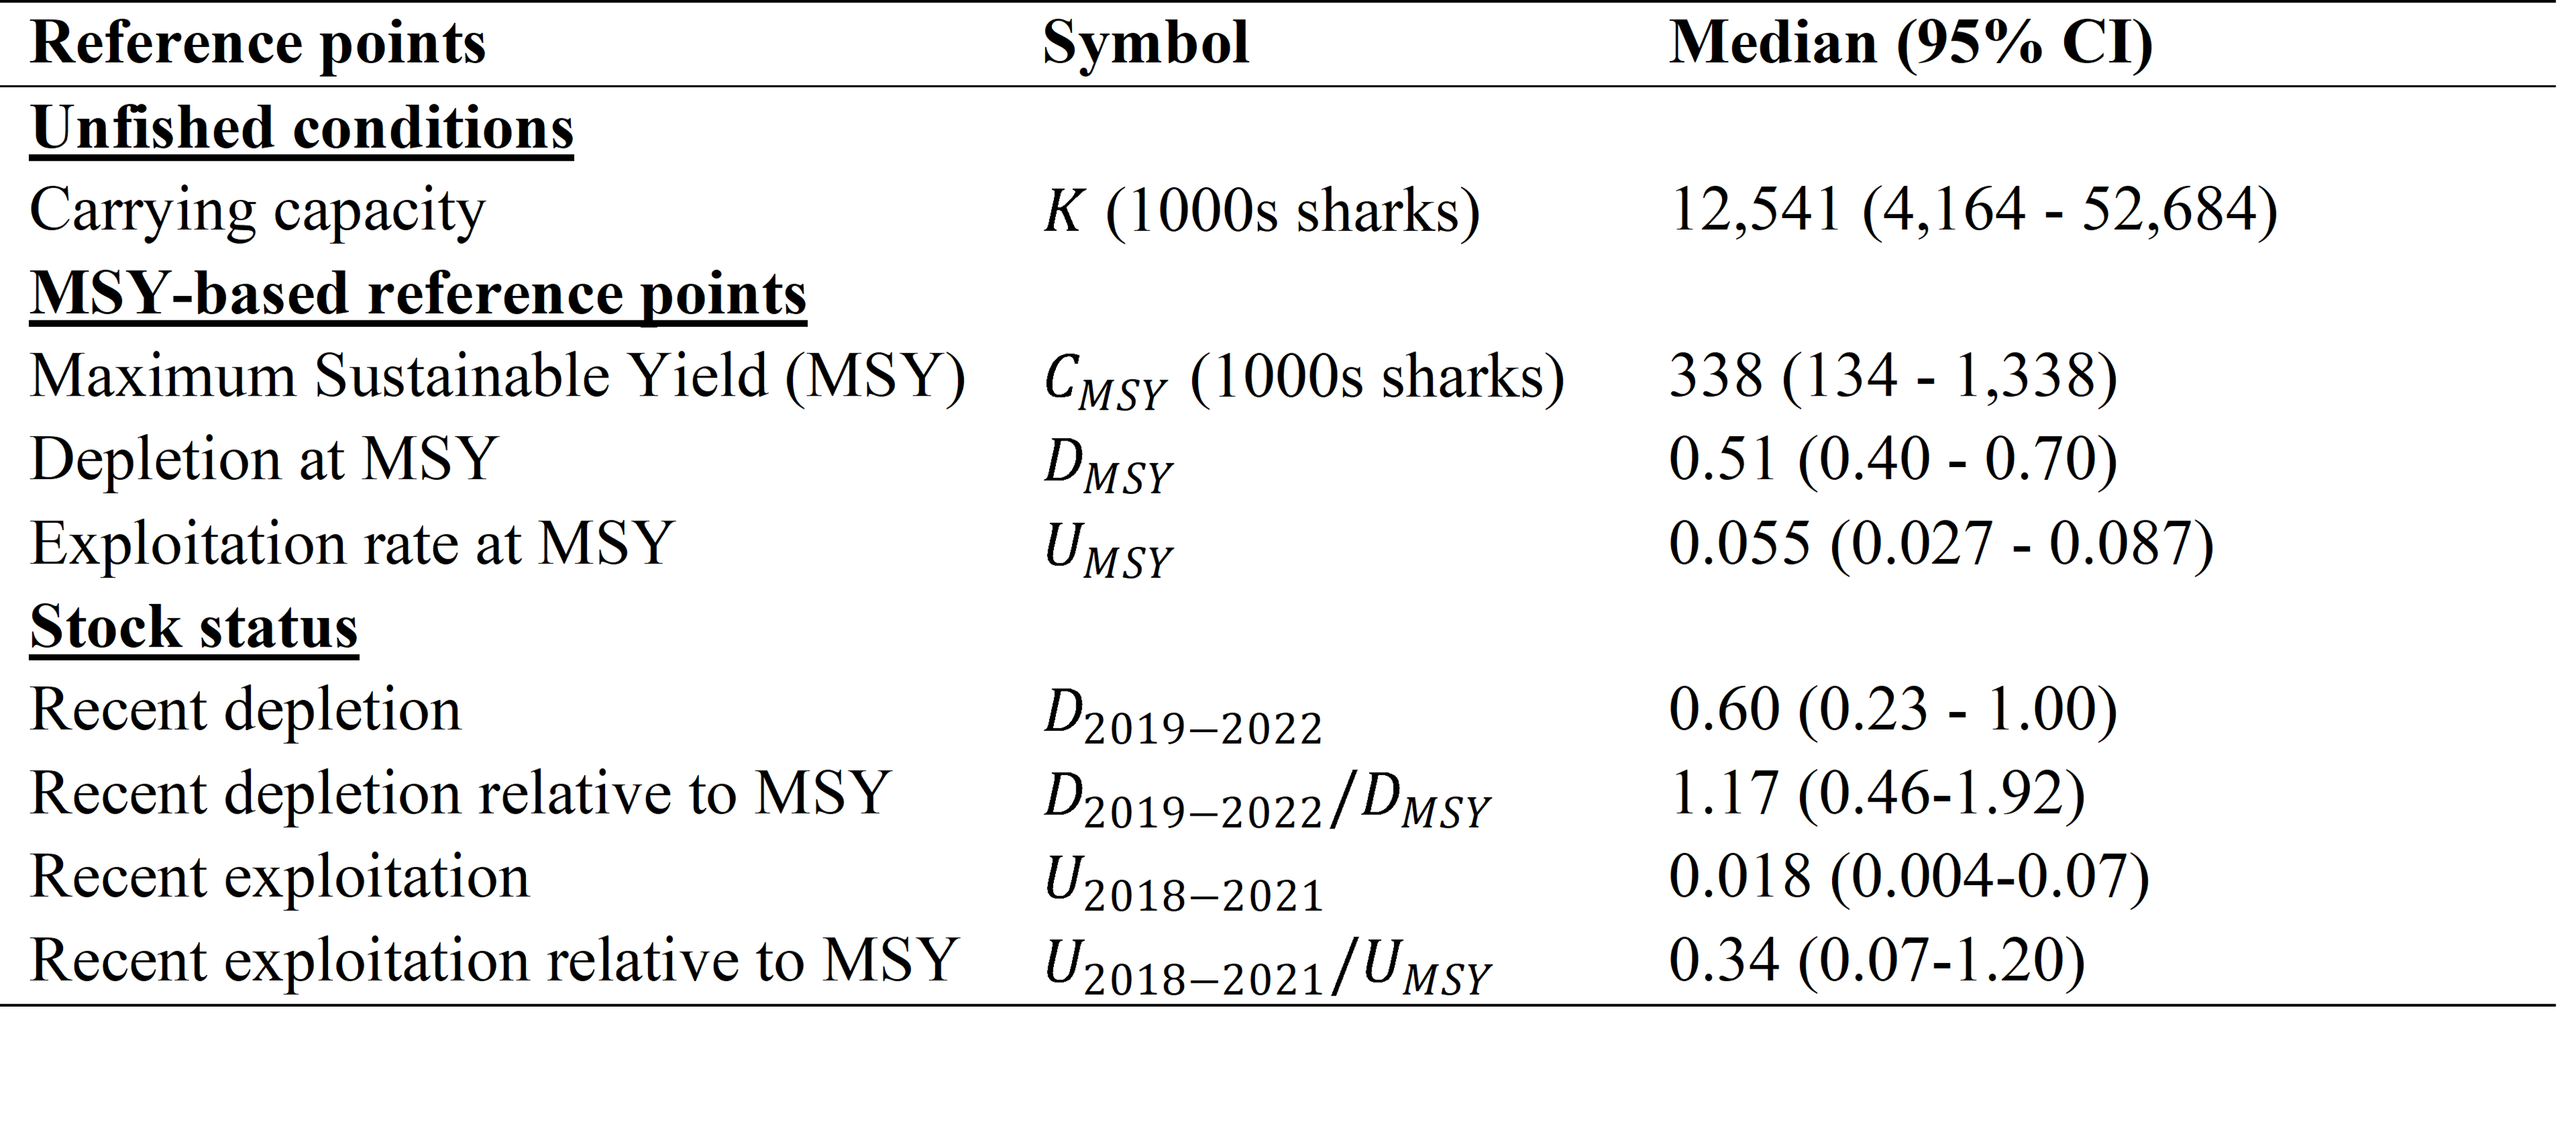
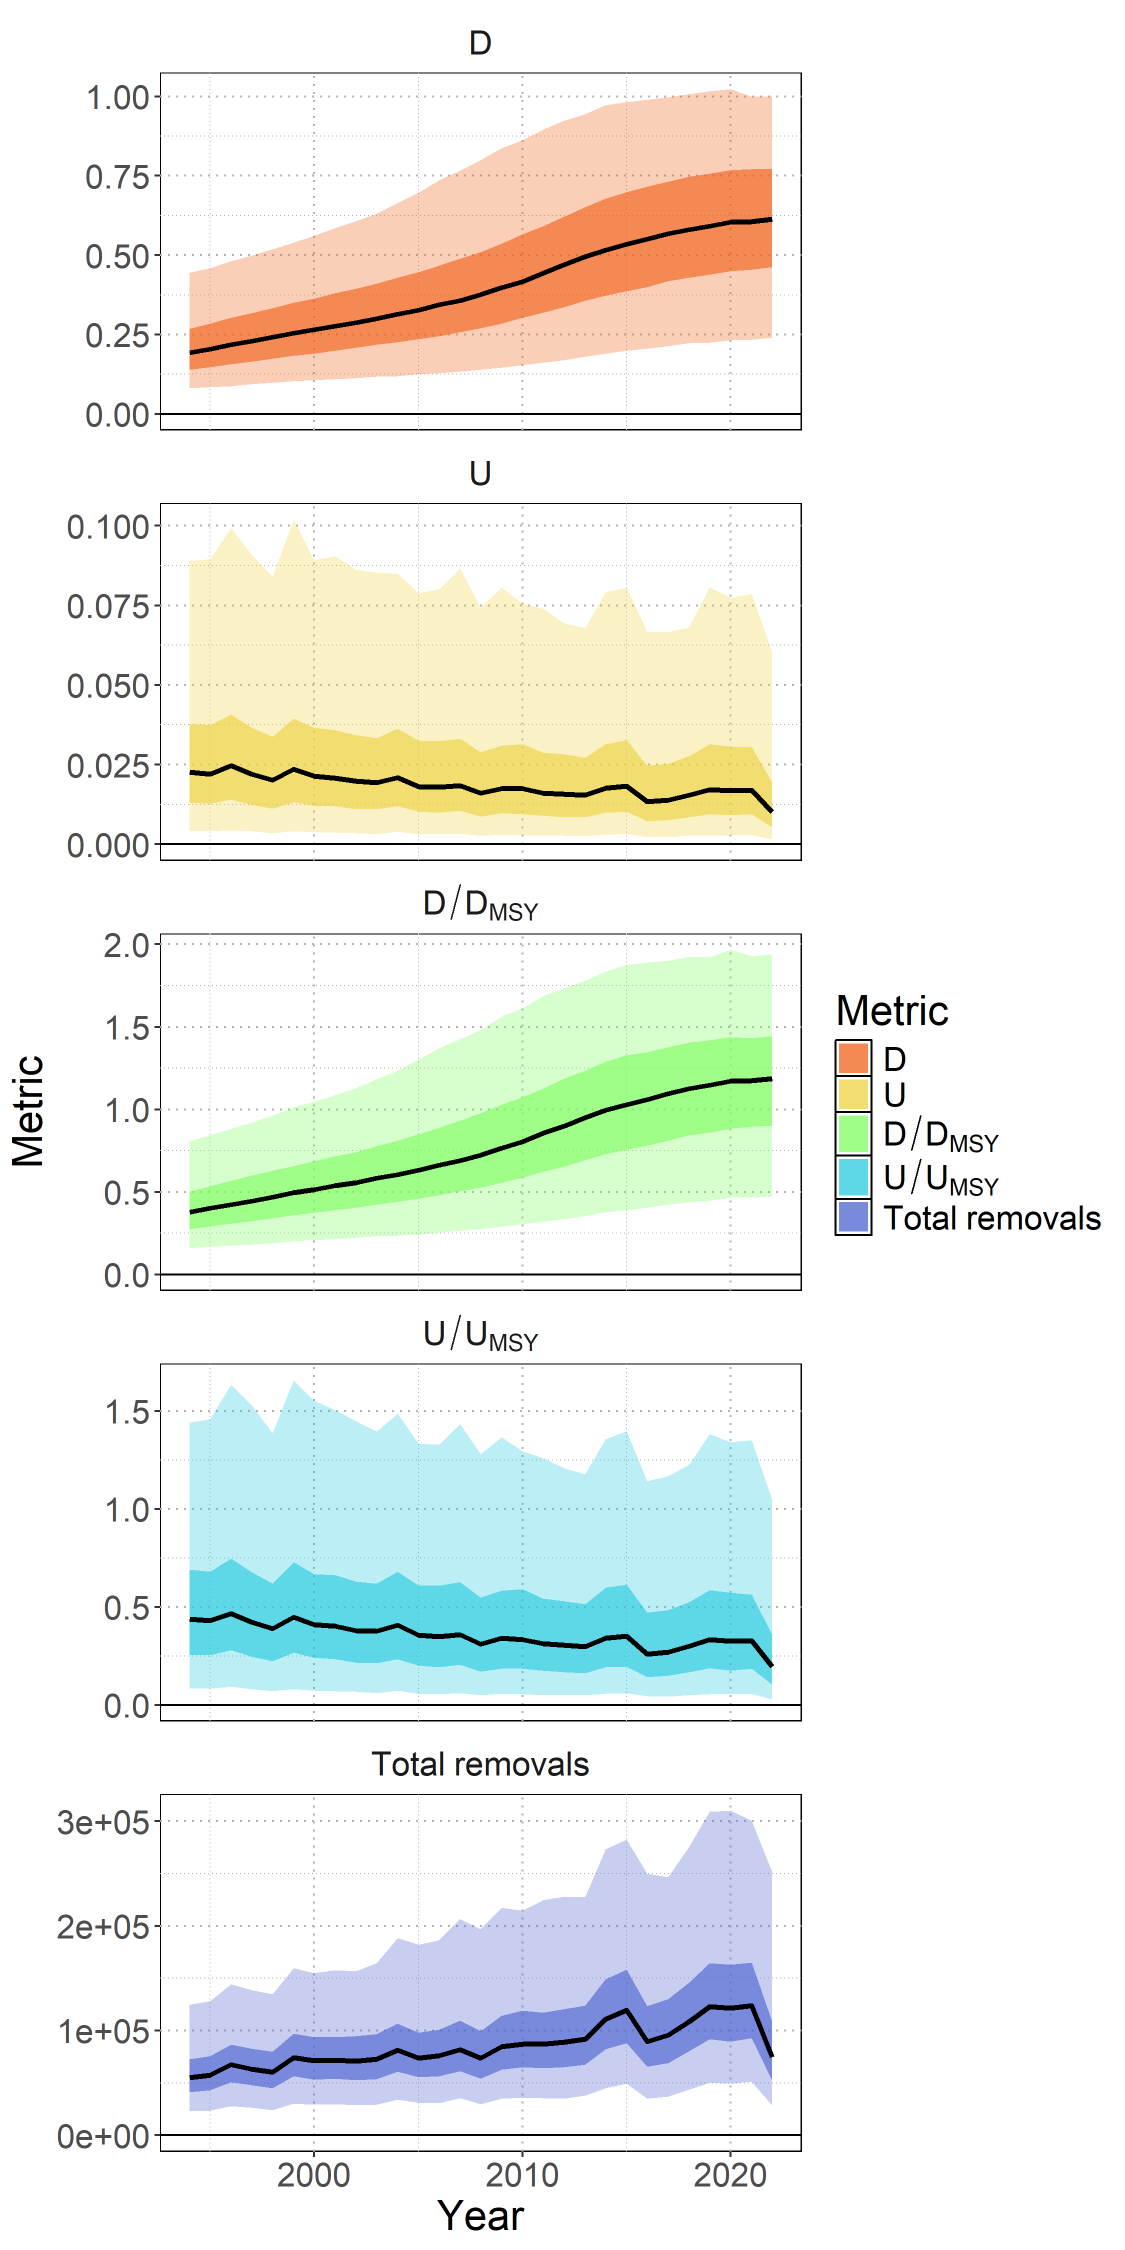
During the 1994-2022 period, the median D of the model ensemble in the initial year D1994 was estimated to be 0.19 (95% CI: credible intervals = 0.08-0.44), and steadily improved over time and D2019-2022 was 0.60 (95% CI = 0.23-1.00) (Table 1 and Figure 1). Although there are large uncertainties in the estimated population scale, the best available data for the stock assessment are four standardized abundance indices from the longline fisheries of Japan, Taiwan, and the US; and all four indices indicate a substantial (>100%) increase in the population during the assessment period. The population was likely heavily impacted prior to the start of the modeled period (1994), after which it has been steadily recovering. It is hypothesized that the fishing impact prior to the modeled period was likely due to the high-seas drift gillnet fisheries operating from the late 1970s until it was banned in 1993, though specific impacts from this fishery on SMA are uncertain as species specific catch data are not available for sharks. Consistent with the estimated trends in depletion, the exploitation rates were estimated to be gradually decreasing from 0.023 (95% CI = 0.004-0.09) in 1994 to the recent estimated exploitation rate (U2018-2021) of 0.018 (95% CI = 0.004-0.07). The decreasing trends in estimated exploitation rates were likely due to the increase in estimated population size being greater than increases in the observed catch.


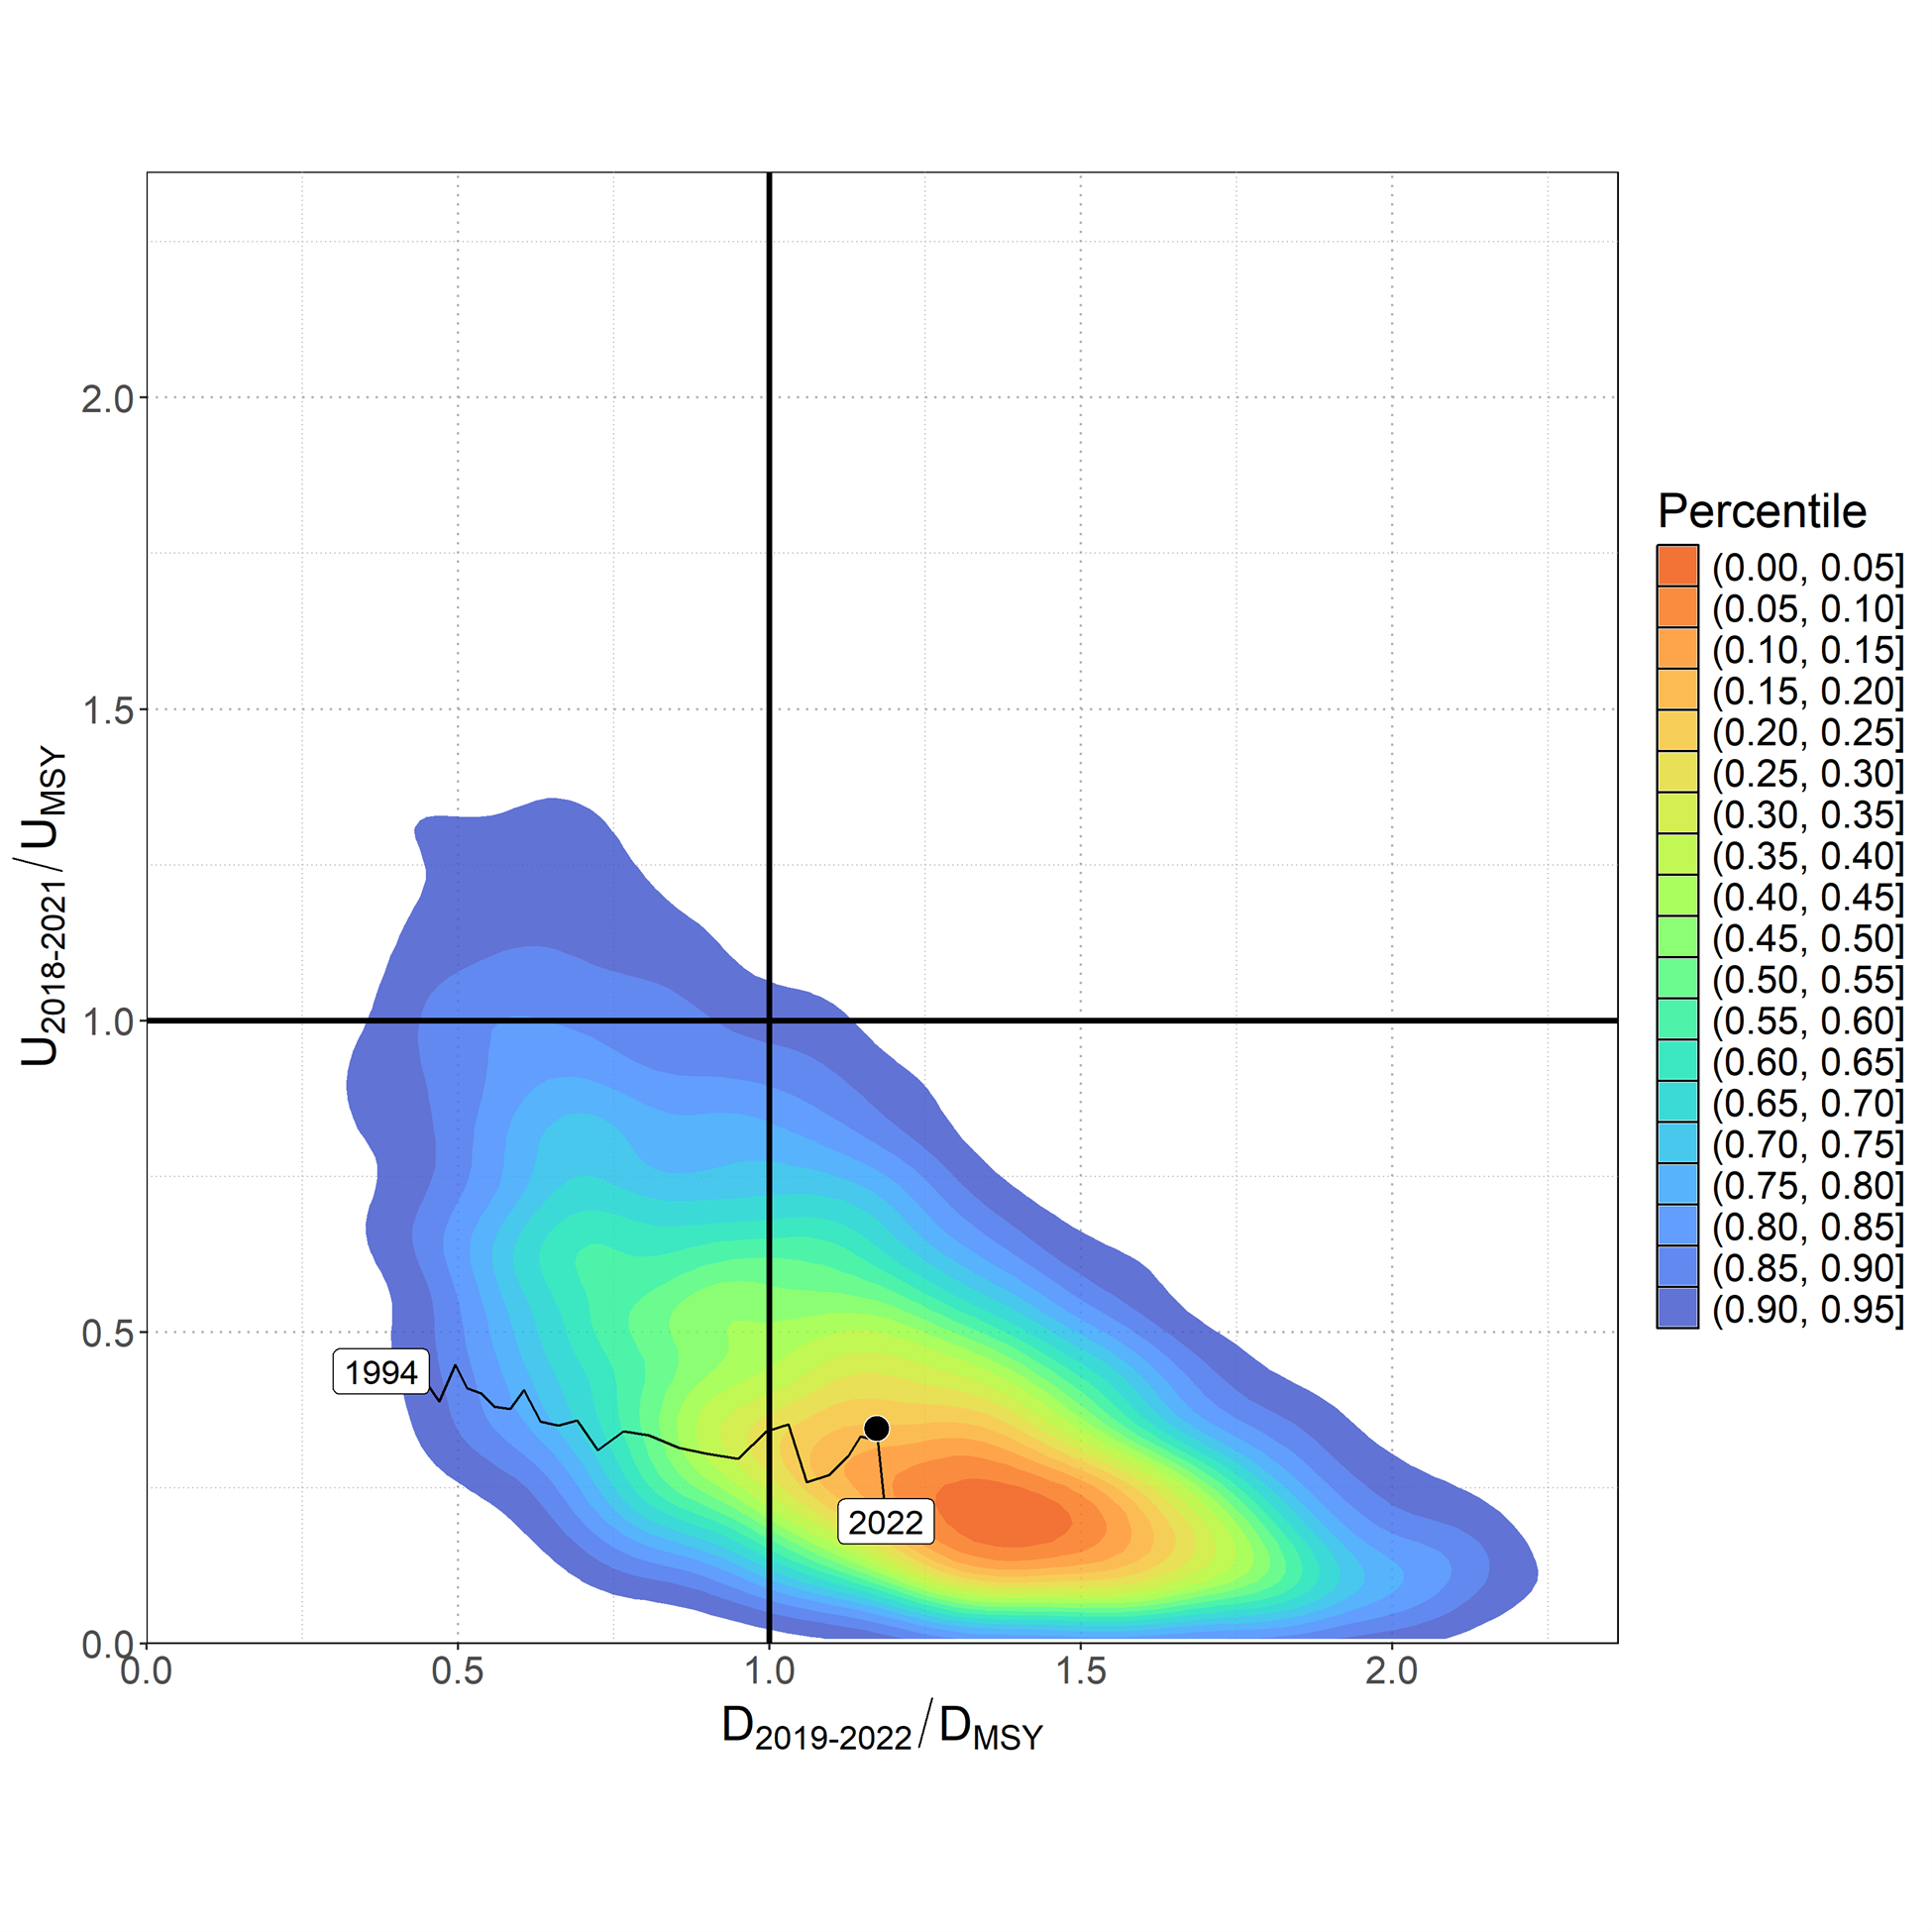
The median of recent D (D2019-2022) relative to the estimated D at MSY (DMSY = 0.51, 95% CI = 0.40-0.70) was estimated to be 1.17 (95% CI = 0.46-1.92) (Table 1 and Figure 1). The recent median exploitation rate (U2018-2021) relative to the estimated exploitation rate at MSY (UMSY = 0.05, 95% CI =0.03-0.09) was estimated to be 0.34 (95% CI = 0.07-1.20) (Table 6 and Figure ). Surplus production models are a simplification of age-structured population dynamics and can produce biased results if this simplification masks important components of the age-structured dynamics (e.g., index selectivities are dome shaped or there is a long time-lag to maturity). Simulations suggest that under circumstances representative of the observed SMA fishery and population characteristics (e.g., dome-shaped index selectivity, long lag to maturity, and increasing indices), the BSPM ensemble may produce biased results. Representative simulations suggested that the D2019-2022) estimate has a positive bias of approximately 7.3 % (median). The trajectories of stock status from the model ensemble revealed that North Pacific SMA had experienced a high level of depletion prior to the start of the model and was likely overfished in the 1990s and 2000s, relative to MSY reference points (Figure ).
Based on these findings, the following information on the status of the NPO SMA is provided by the ISC24 Plenary:
- No biomass-based or fishing mortality-based limit or target reference points have been established for NPO SMA by the IATTC or WCPFC;
- Recent median D (D2019-2022) is estimated from the model ensemble to be 0.60 (95% CI = 0.23-1.00). The recent median D2019-2022 was 1.17 times DMSY (95% CI = 0.46-1.92) and the stock is likely (66% probability) not in an overfished condition relative to MSY-based reference points;
- Recent U (U2018-2021) is estimated from the model ensemble to be 0.018 (95% CI = 0.004-0.07). U2018-2021 was 0.34 times (95% CI = 0.07-1.20) U_MSY and overfishing of the stock is likely not occurring (95% probability) relative to MSY-based reference points;
- The model ensemble results show that there is a 65% joint probability that the North Pacific SMA stock is not in an overfished condition and that overfishing is not occurring relative to MSY based reference points; and
- Several uncertainties may limit the interpretation of the assessment results including uncertainty in catch (historical and modeled period) and the biology and reproductive dynamics of the stock, and the lack of CPUE indices that fully index the stock.
Conservation Information
Stock projections of depletion and catch of North Pacific SMA from 2023 to 2032 were performed assuming four different harvest policies: U2018-2021, UMSY, U2018-2021+20%, and U2018-2021)-20% and evaluated relative to MSY-based reference points (Figure 2). Based on these findings, the following conservation information is provided:

- Future projections in three of the four harvest scenarios (U2018-2021), U2018-2021)+20%, and U2018-2021-20%) showed that median D in the North Pacific Ocean will likely (>50% probability) increase; only the UMSY harvest scenario led to a decrease in median D.
- Median estimated D of SMA in the North Pacific Ocean will likely (>50% probability) remain above D_MSY in the next 10 years for all scenarios except UMSY; harvesting at UMSY decreases D towards DMSY (Figure 2).
- Model projections using a surplus production model may oversimplify the age structured population dynamics and as a result could be overly optimistic.