Stock Status and Conservation Information
(From ISC23 Plenary Report)
- Albacore
- Pacific Bluefin
- Blue Marlin
- Striped Marlin
- Swordfish
- Blue shark
- Shortfin mako
Pacific Striped Marlin
![]() Click here to see the ISC22 stock status and conservation information.
Click here to see the ISC22 stock status and conservation information.
Stock Status
Estimates of population biomass from the base case fluctuated around an average of 11,300 t during 1977-2020 and was estimated to be 7,300 t in 2020 (Figure 1a). Initial estimates of female SSB averaged around 4,700 t during the 1977-1979 period. SSB was at its highest level of 5,096 m t in 1977, and declined to its lowest level, 1,080 t, in 2011. The time series of SSB during 2011-2020 averaged about 1,200 metric tons (Table 1), or about 33% of the dynamic 20 year 20%SSBF=0 and about 42% of SSBMSY (Table 2). Overall, SSB exhibited a strong decline during 1992-1998 and has stabilized to an average of about 1,400 t through the 2000s (Figure 1b; Table 1). Estimated fishing mortality (arithmetic average of F for ages 3-12) increased from 0.53 yr-1 in 1977 to a peak of 1.42 yr-1 in 1998, and subsequently declined to 0.58 yr-1 in 2020 (Figure 1c; Table 4). It averaged roughly F=0.68 yr-1 during the 2018-2020 period or about 28% above F20%SSB(F=0) and 8% above FMSY, with a relative fishing mortality of F/F20%SSB(F=0) = 1.09 in 2020 (Table 2). Fishing mortality has been above F20%SSB(F=0) and FMSY since the beginning of the assessment time period but has had a declining trend since 1998. Recruitment (numbers of age 0 fish) estimates averaged approximately 366,000 during the 1977-2020 period. While the overall pattern of recruitment from 1977 to 2020 varied, there was an apparent declining trend in recruitment strength over time with higher recruitments observed during the 1977-1992 period and lower recruitments from 2000 to the present (Figure 1d).
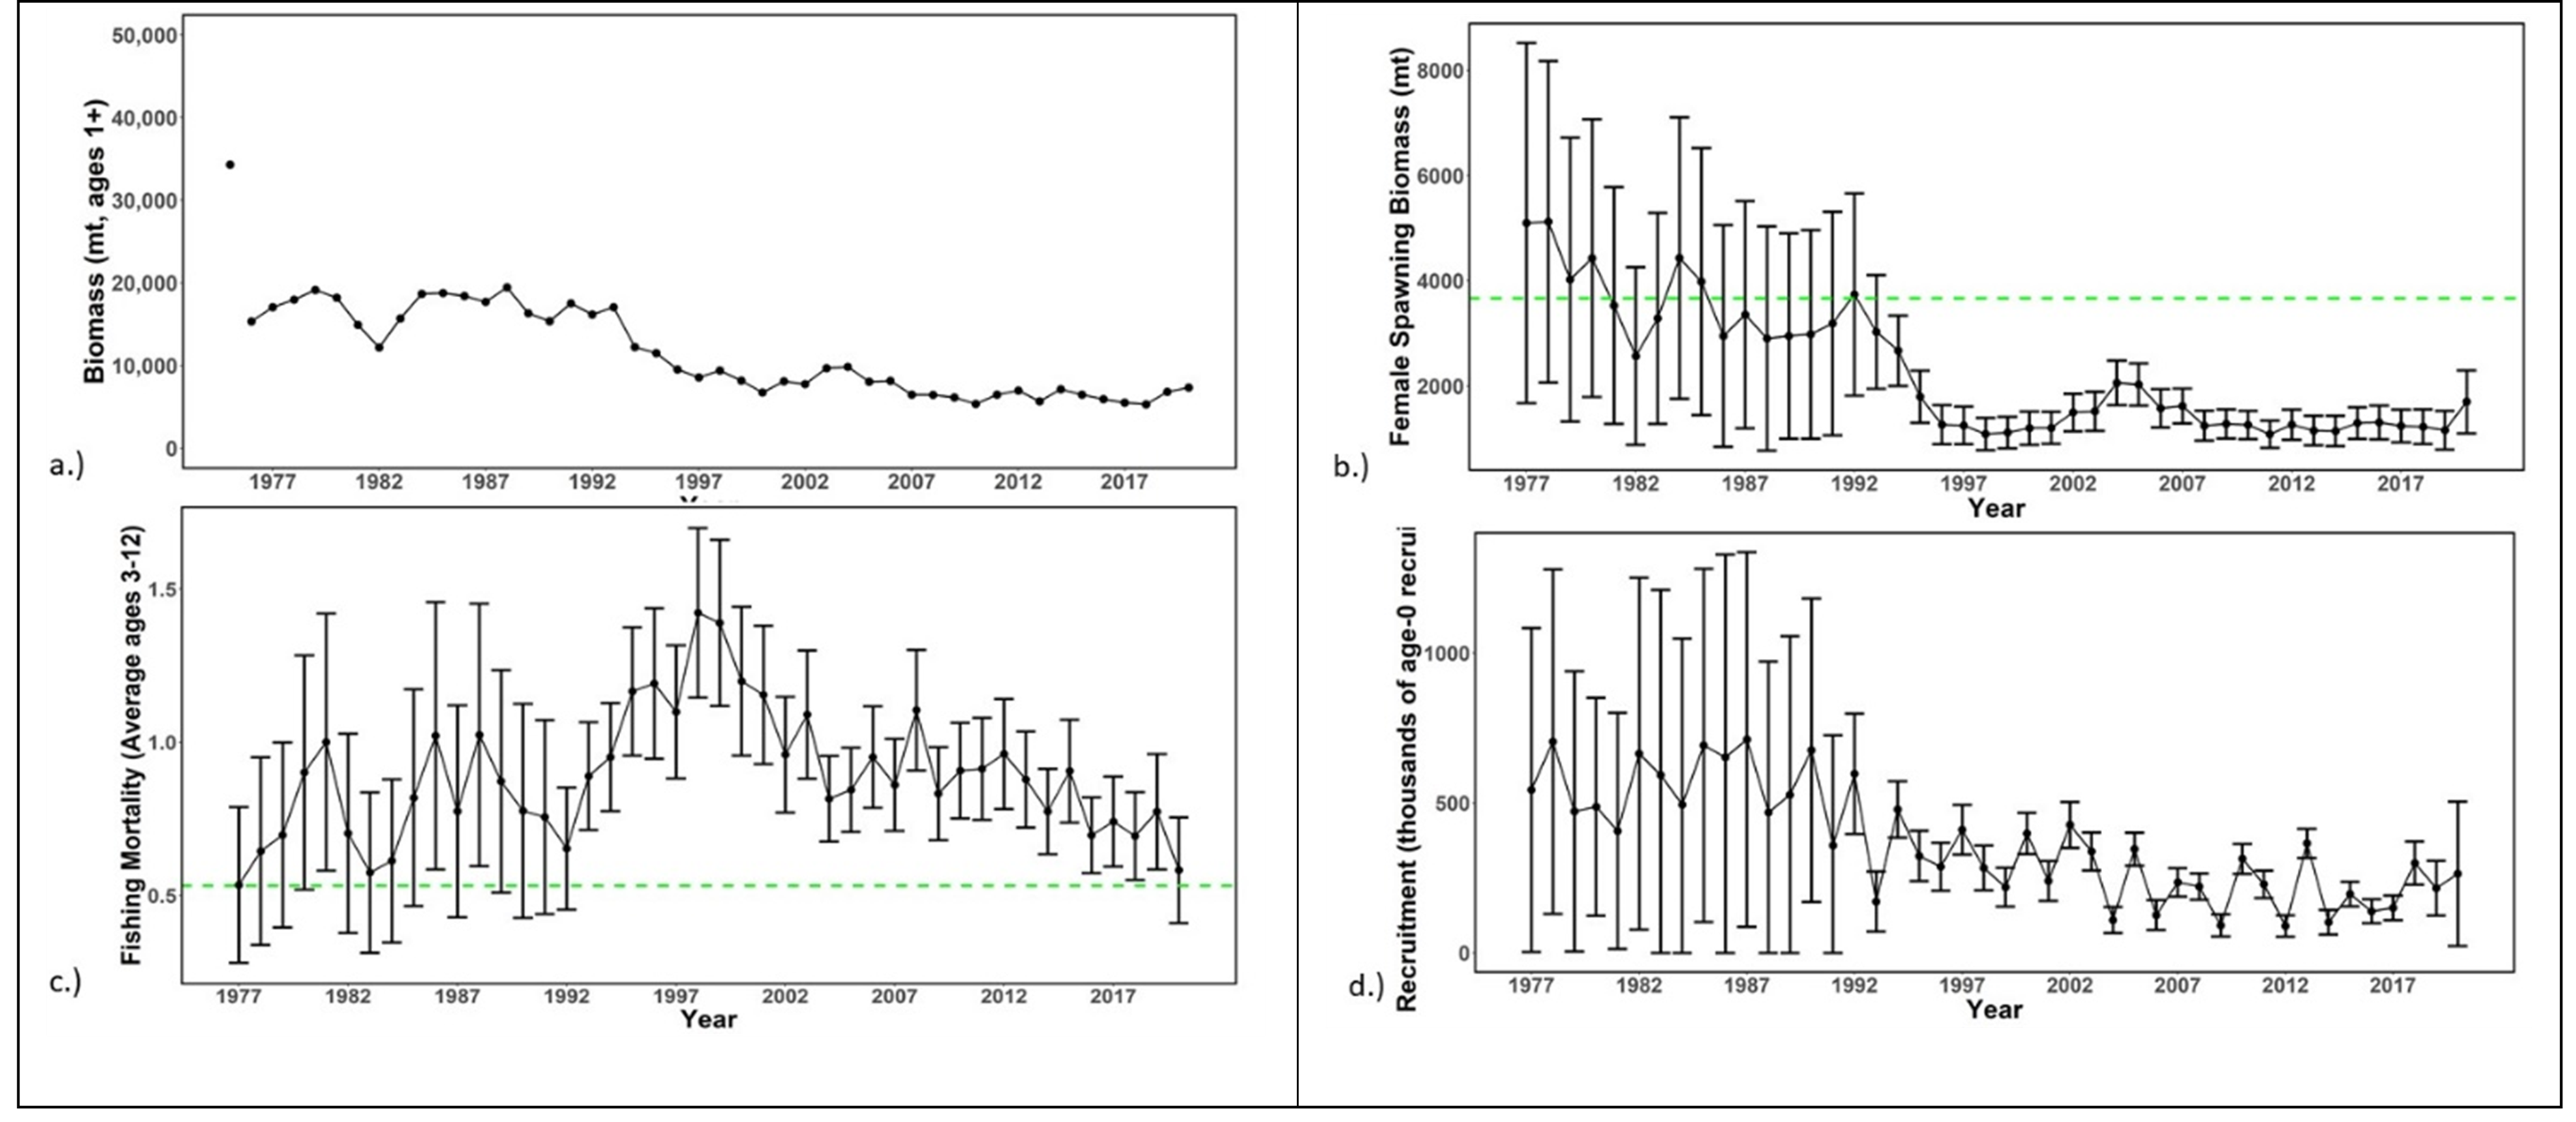


Recruitment from 2001 to 2020 averaged about 225,000 age-0 fish, which was 60% of the 1977-2020 average. The WCPFC has requested that the BILLWG provide estimates of stock status for WCNPO MLS relative to biological reference points based on 20% of a dynamic SSB0 estimate (SSBF= 0), where SSB0 is the moving average of the last 20 years of SSB0 estimates. Despite the relatively large L50/Linf ratio for WCNPO MLS, the stock is expected to be highly productive due to its rapid growth and high resilience to reductions in spawning potential. Recent recruitments have been lower than expected and have been below the long term average since 2000 (Figure 1d; Table 1). Although fishing mortality has decreased since 2000, two decades of low recruitment combined with consistent landings of immature fish have inhibited increases in spawning biomass since 2001.
Based on these findings, the following information on the status of the WCNPO MLS stock is provided by the ISC23 Plenary:
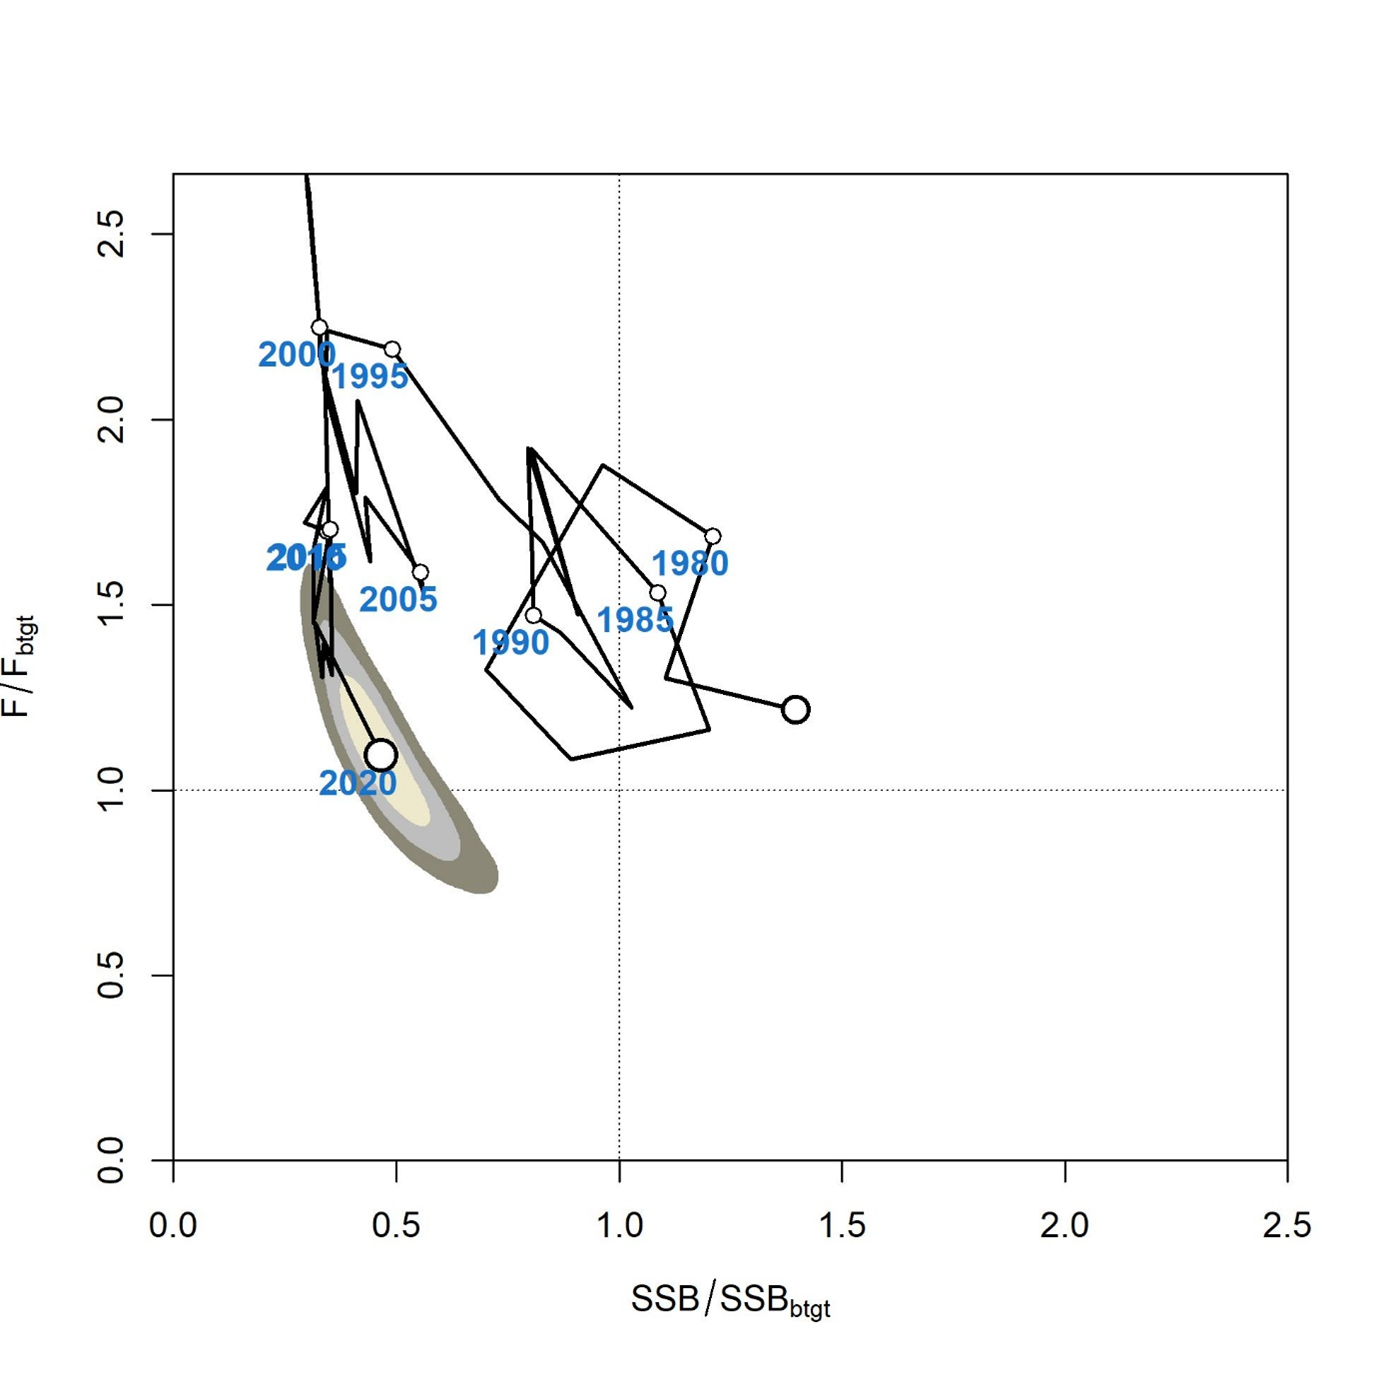
- When the status of WCNPO MLS is evaluated relative to dynamic 20%SSB(F=0) based reference points, the 2020 spawning stock biomass of 1,696 t is 54% below 20%SSBF=0 (3,660 t) and the 2018-2020 fishing mortality is about 28% above F20%SSB(F=0) (Table 2); and
- Therefore, relative to 20%SSBF=0 based reference points, the WCNPO MLS stock is very likely to be overfished (>99% probability) and is likely to be subject to overfishing (>66% probability; Figure 2).
Conservation Information
Stock projections for WCNPO MLS were conducted using two deterministic scenarios for future recruitment: the expected stock recruitment relationship and the average recruitment in the last 20 years (2001-2020). Projections started in 2021 and continued through 2040. Five levels of fishing mortality with the two recruitment scenarios (Table 3) and the ten catch levels with only the 20-year average recruitment scenario (Table 4) were applied for projections. The five fishing mortality scenarios were: F status quo (average F during 2018-2020), FMSY, F at 20%SSBF= 0, FHigh at the highest 3-year average during 1977-2017 (1998-2000), and FLow at F30%. The ten catch level scenarios were: No catch (F=0), 500 t catch, 1,000 t catch, 1,500 t catch, 2,000 t catch, 2,300 t catch, 2,400 t catch, 2,500 t catch, 3,000 t catch, and 3,500 t catch.

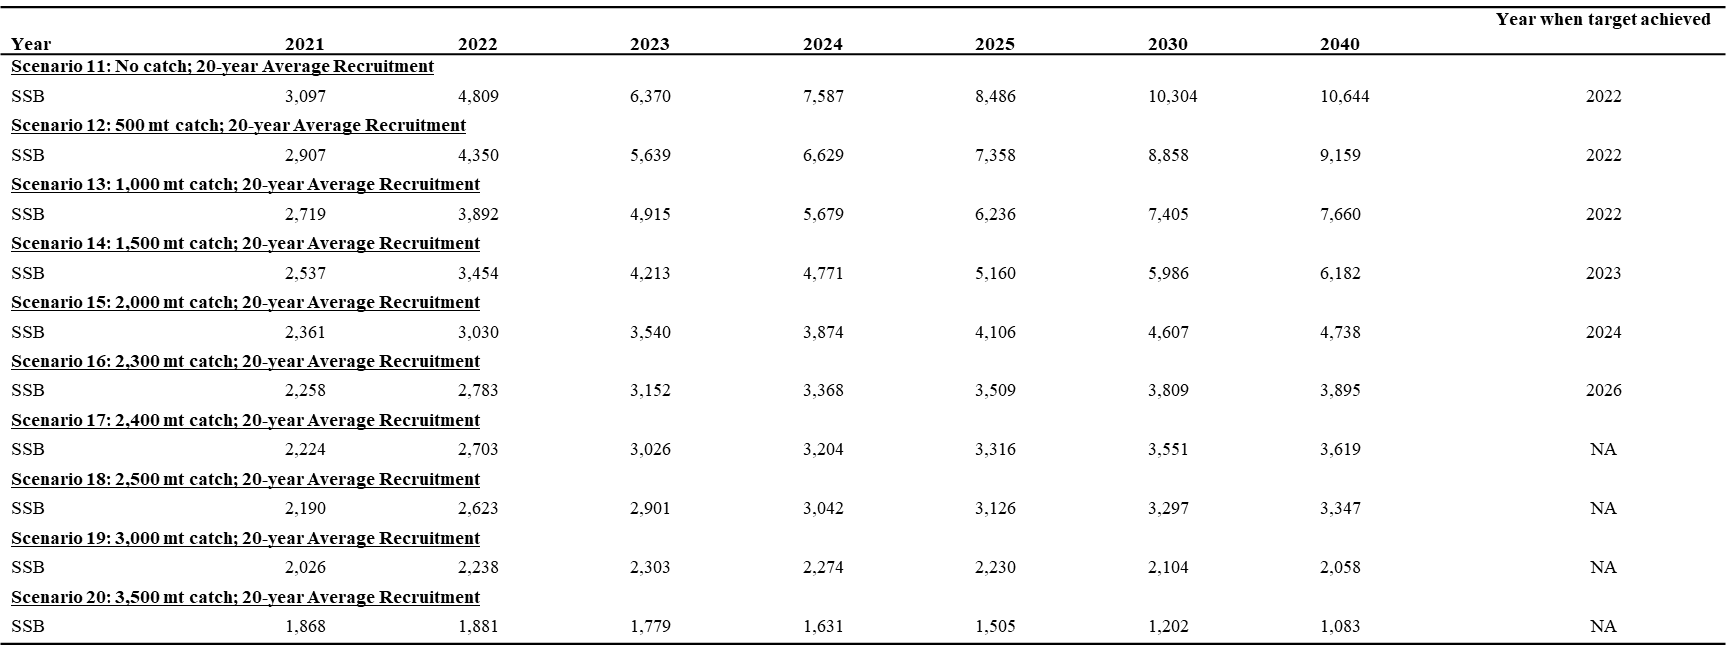
Twenty results show the projected female spawning stock and catch biomasses under each scenario (Table 3 and Table 4 ; and Figure 3 ). When recruitment is assumed to be consistent with the stock recruitment relationship, then only two fixed F scenarios result in the WCNPO MLS stock rebuilding beyond SSBMSY and 20%SSBF=0: FLow and F20%SSB(F=0) (Figure 3a). In contrast, when recruitment is assumed to be the average over the last 20 years (2001-2020), none of the fixed F scenarios result in the stock rebuilding to or beyond F20%SSB(F=0) and only one scenario, FLow, resulted in the stock rebuilding above the SSBMSY level (Figure 3b). Constant catch scenario results are different that the constant F projection results. At catch levels less than 2,400 t, the projections show that the WCNPO MLS stock rebuilds beyond the SSBMSY and 20%SSBF=0 levels by 2040 (Figure 3c).
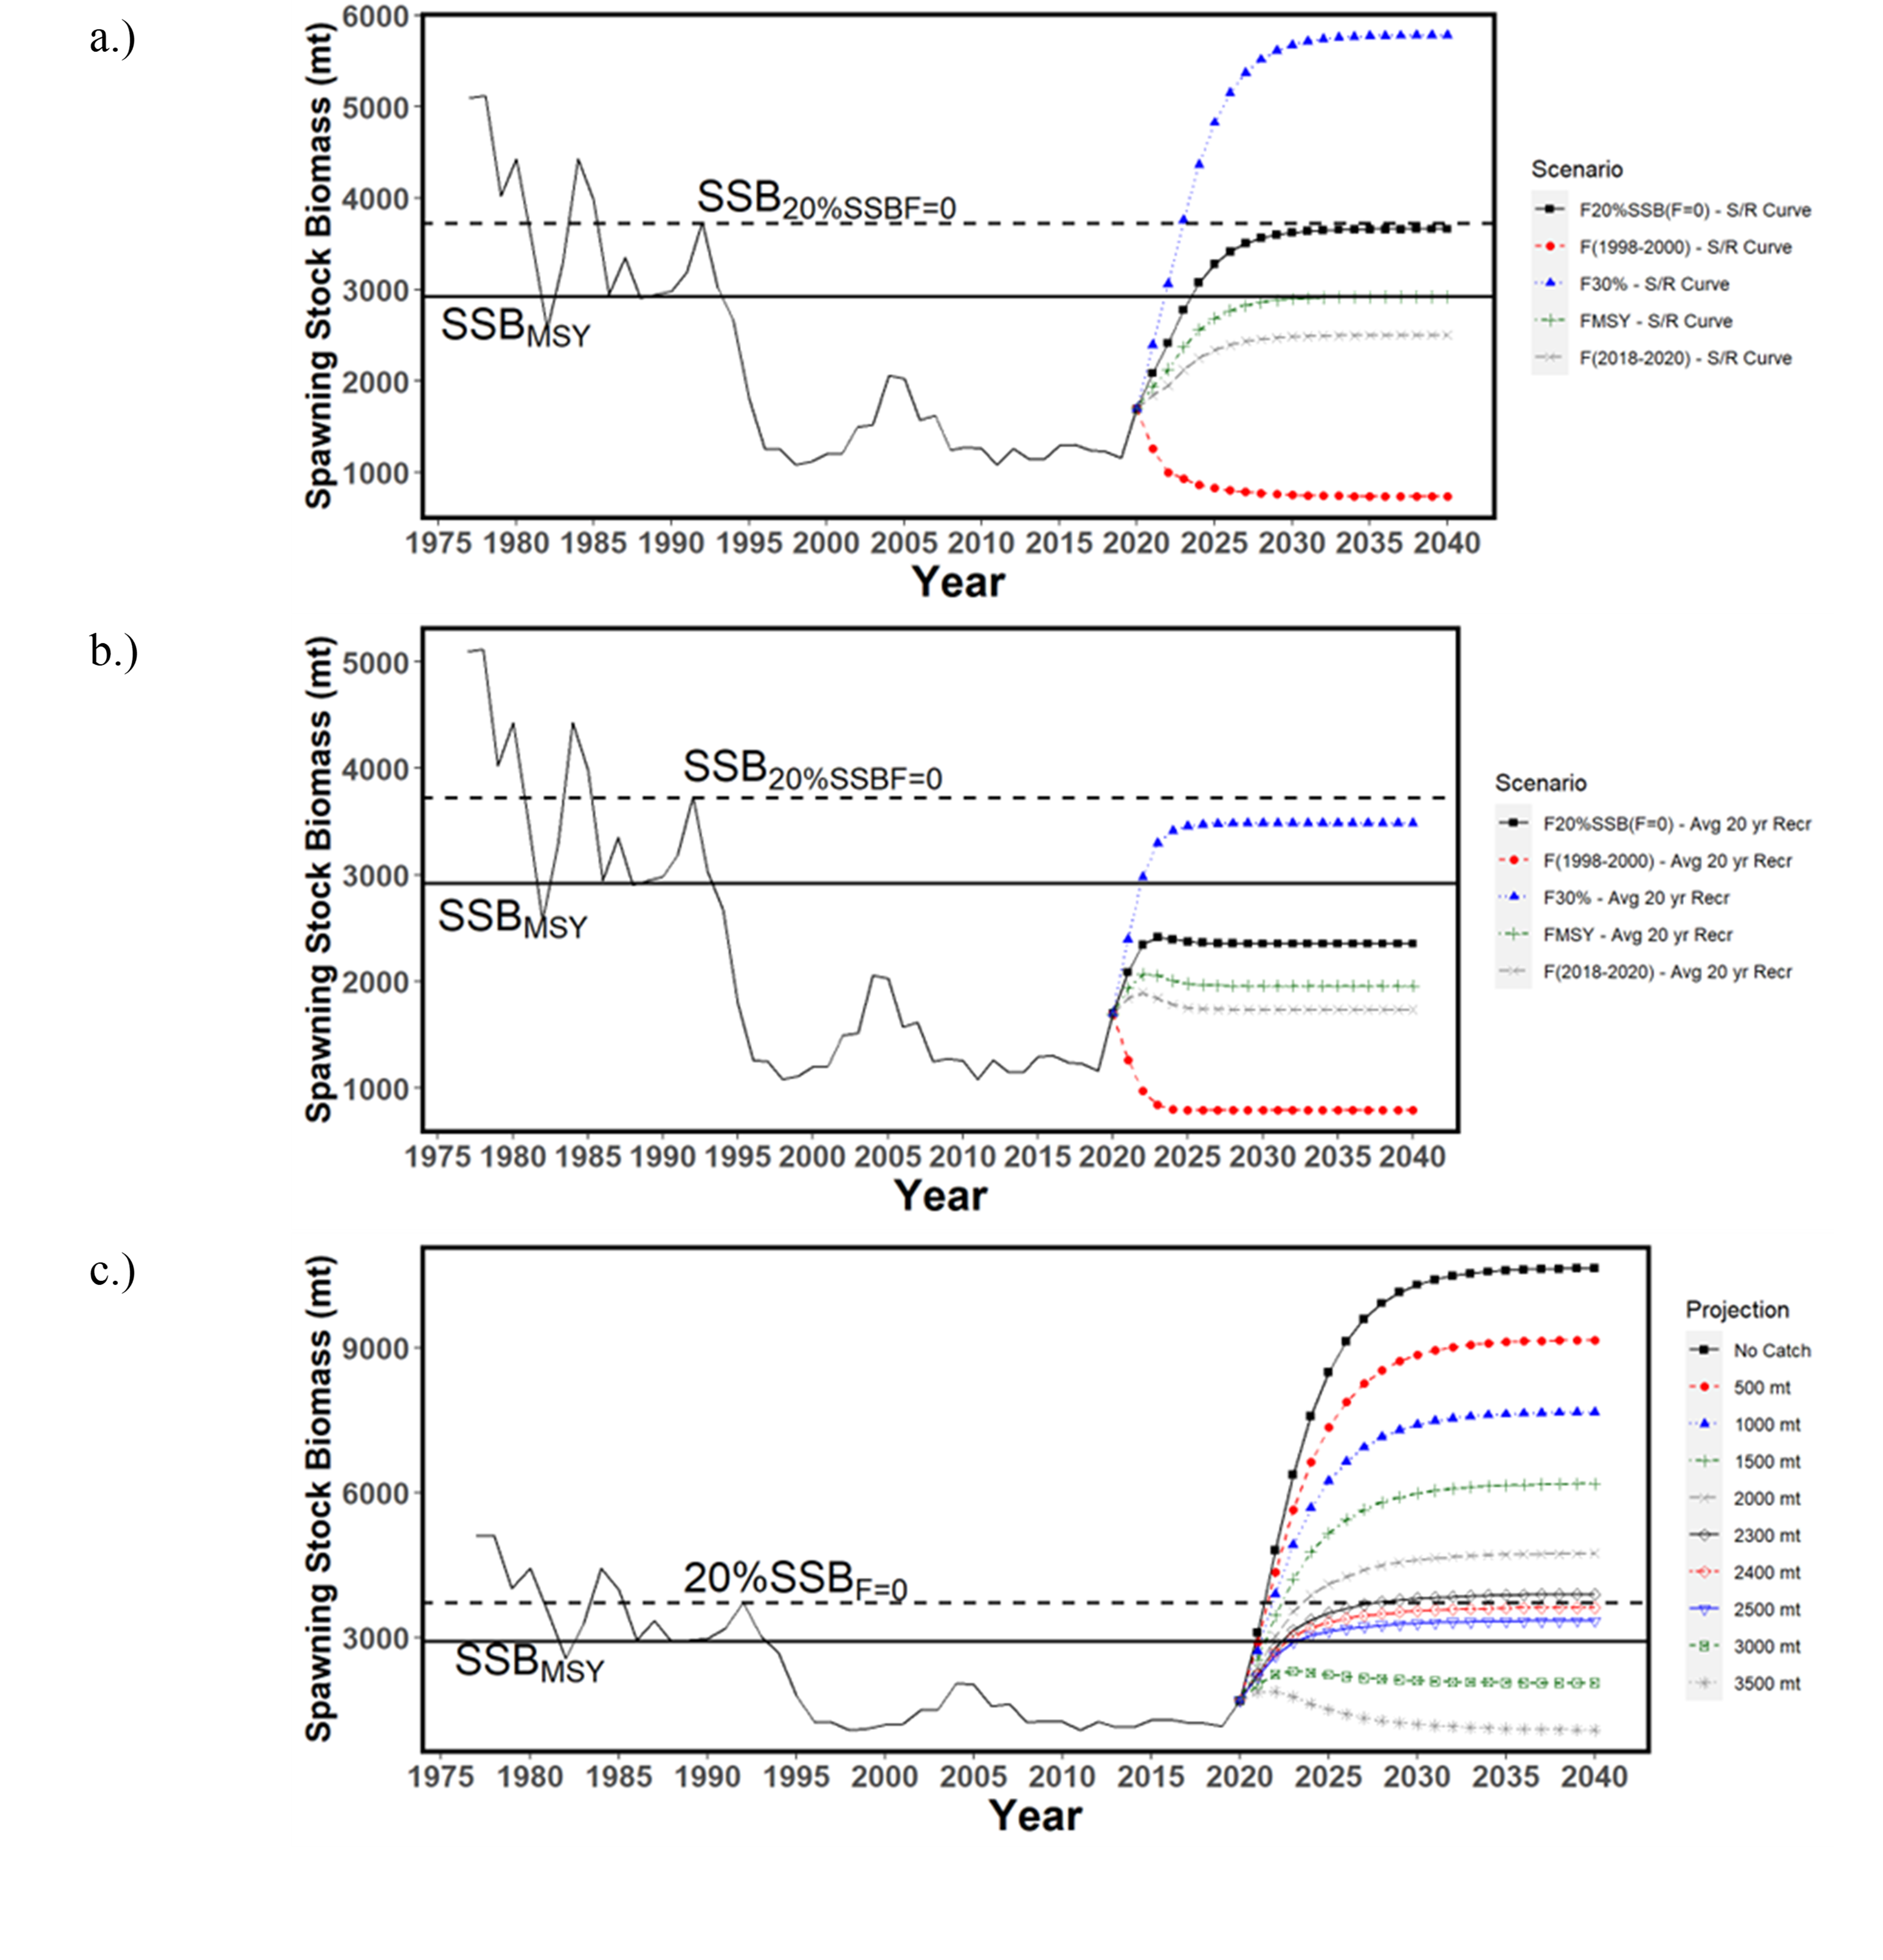
The assumed recruitment levels for projections vary substantially for the two scenarios, with the average recruitment from the stock recruitment curve around 350,000 individuals per year and the recruitment from the low recruitment scenario around 225,000 individuals per year. In the past, the WG has recommended that management measures consider the low recruitment scenarios as the projections using the stock recruitment curve do not consider the long-term declining trend in recruitment (ISC21). If spawning biomass rebuilds to the target, which is about equal to the average spawning biomass observed during the 1977-1989 period, then recruitment may be expected to return to the high levels observed during the 1977-1989 period or about 2 fold higher than current recruitment (Figure 1d). The WG intends to provide additional stochastic ensemble projection results considering model uncertainty, as requested by WCPFC16. One of the important axes of uncertainty will be the assumptions on future recruitment.
Based on these findings, the following information on the conservation of the WCNPO MLS stock is provided by the ISC23 Plenary:
- It is recommended that catch should be kept at or below the recent level (2018-2020 average catch = 2,428 t); and
- The results of deterministic projection show that when catches are 2,400 t, or less, the stock is expected to recover above SSBMSY and near the 20% SSBF=0 reference level by 2040, or sooner at the lower catch levels under a low recruitment regime (3,660 t).
Special Comments
While the WG agreed upon a base case model for WCNPO MLS, there is concern about the reliability of the base case results for providing conservation advice due to uncertainty in growth, Japanese driftnet catches and initial conditions of the model. The ISC22 Plenary requested that the WG continue working on the 2022 WCNPO MLS base case model, with a focus on the growth parameters, particularly incorporating the Richard’s four parameter growth curve directly into the SS3 model, for presentation to ISC23. The WG concluded that a revised von Bertalanffy growth curve rather than the Richard’s curve was the best information available at this time for use in the 2023 base case model, while highlighting the suite of sensitivity runs to show the sensitivity of the model to changes in the growth curve (Figure ; see the list and description of the sensitivity runs in table 12 in ISC/23/ANNEX/14). The sensitivity runs show that the growth curve assumption may affect the interpretation of stock status. The WG also noted a concern that the estimation of initial F and thus the virgin biomass scale is largely affected by the selection of the growth curve, as the initial catch remains uncertain.
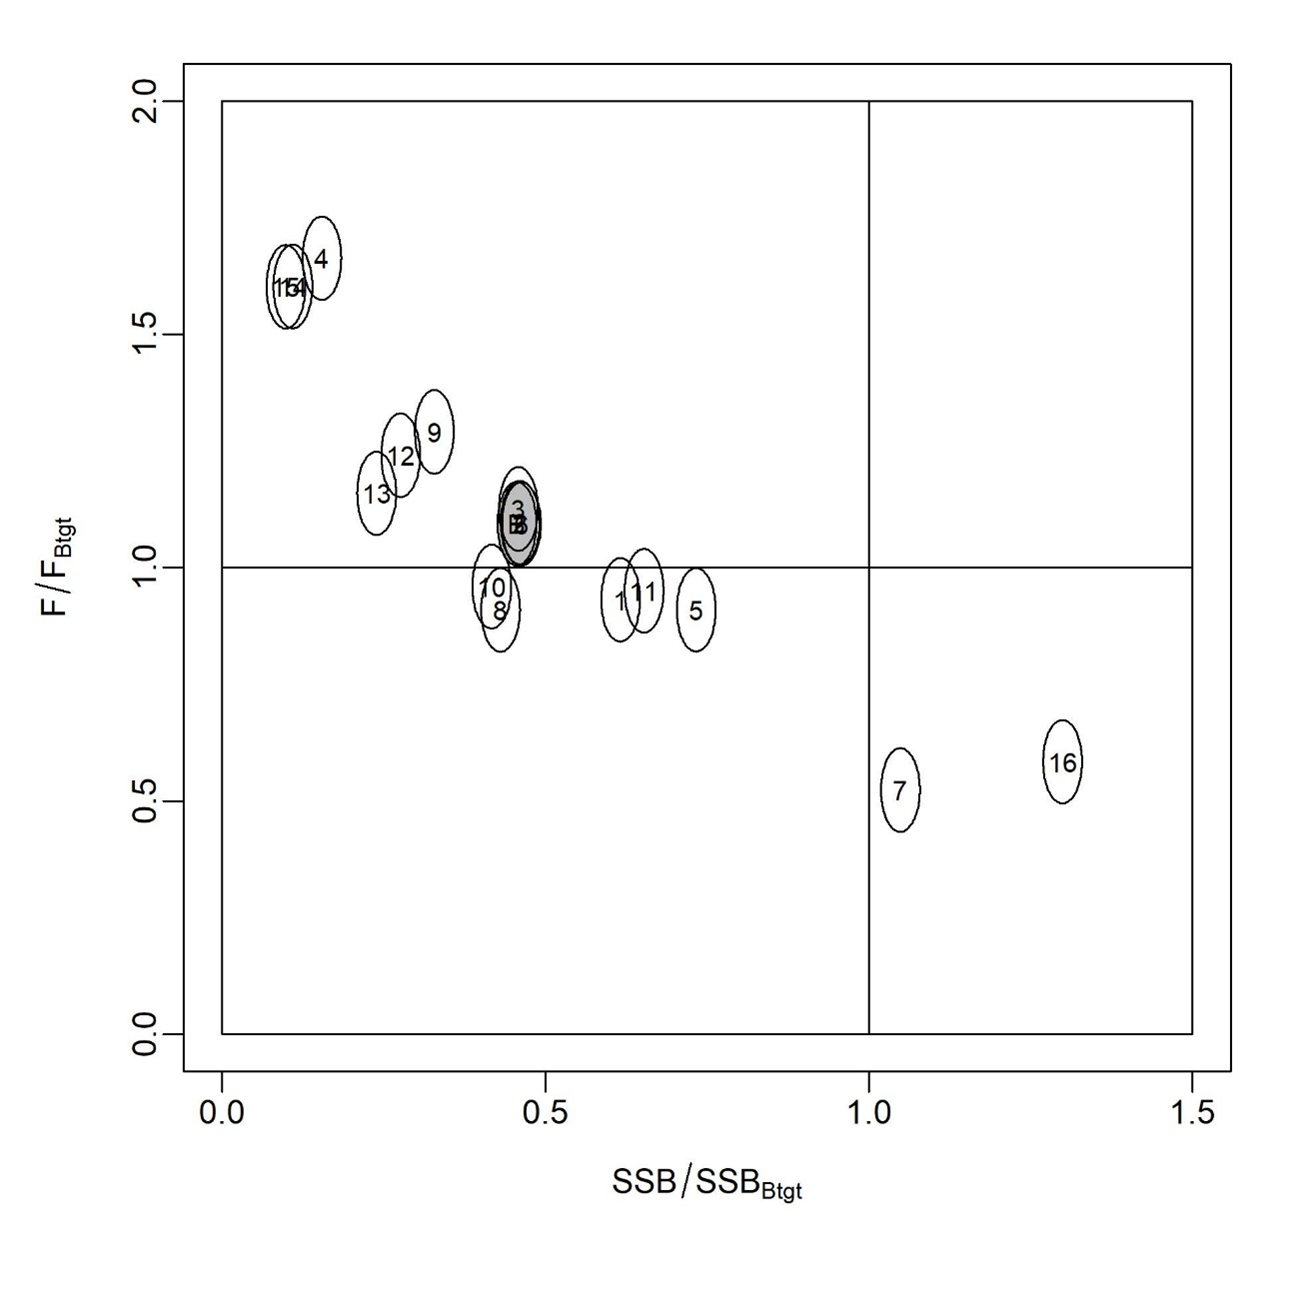
The WG recognized that substantial uncertainties have been discussed and documented in this stock assessment report. The high seas drift net catch data are highly uncertain owing to limited record availability, the estimation of life history parameters, such as growth, from limited data, and the mixing of the stock with other management areas, as revealed by genetic analyses. The WG evaluated the fit of several growth assumptions to the data and other diagnostics. The WG found that the stock assessment results showed large differences in estimated biomass among various growth curves. Future improvements of the growth curve are expected due to incoming data from the ongoing International Billfish Biological Sampling program, which will be followed by continued biological research and model development to address other sources of uncertainty.