Stock Status and Conservation Information
(From ISC22 Plenary Report)
Blue shark
![]() Click here to see the ISC21 stock status and conservation information.
Click here to see the ISC21 stock status and conservation information.
Stock Status
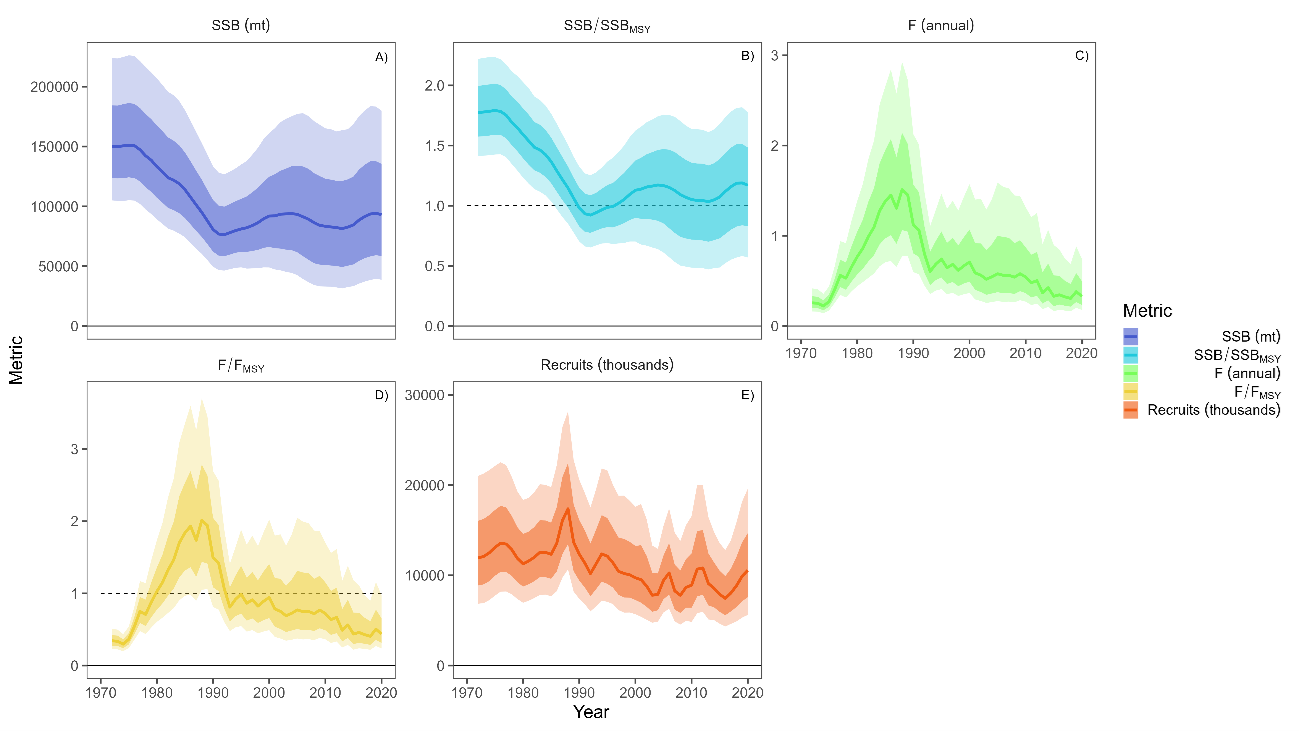
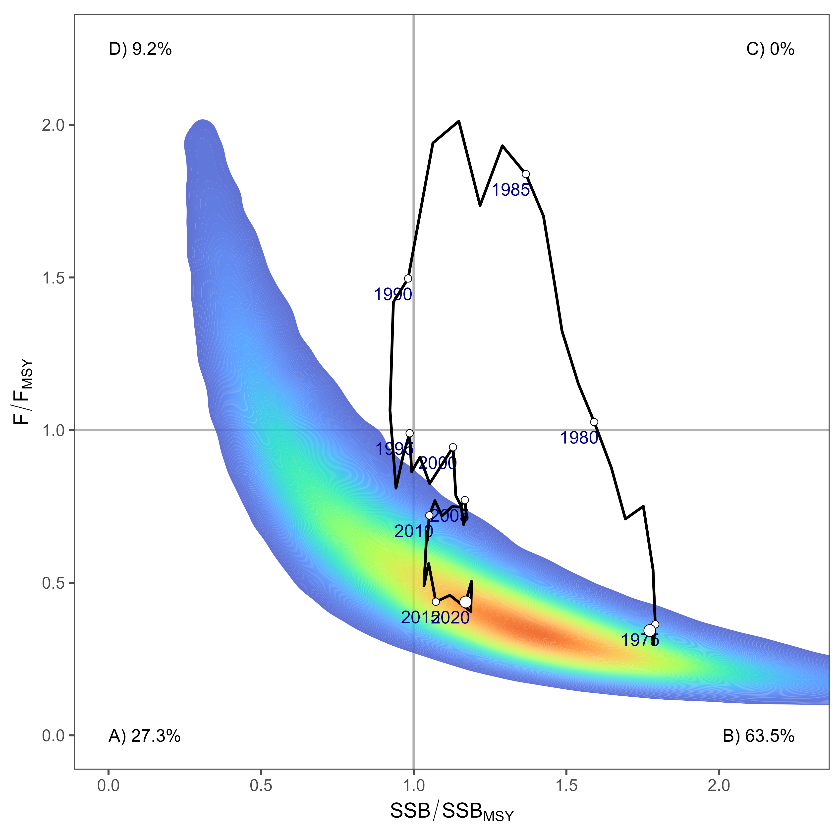
The median of the annual spawning stock biomass (SSB) from the model ensemble had a steadily decreasing trend until 1992 and a slightly increasing trend until recent years (Figure 1 A,B). The median of the annual F from the model ensemble gradually increased in the late 1970s and 1980s and suddenly dropped around 1990, which slightly preceded the high-seas drift gillnet fishing ban, after which it has been slightly decreasing (Figure 1 C,D). The median of the annual age-0 recruitment estimates from the model ensemble appeared relatively stable with a slightly decreasing trend over the assessment period except for 1988, which shows a large pulse (Figure 1 E). The historical trajectories of stock status from the model ensemble revealed that North Pacific BSH had experienced some level of depletion and overfishing in previous years, showing that the trajectories moved through the overfishing zone, overfished and overfishing zone, and overfished zone in the Kobe plots relative to MSY-based reference points (Figure 2). However, in the last two decades, median estimates of the stock condition returned to the bottom-right quadrant of the Kobe plot. Estimates of key management quantities for the North Pacific blue shark SS3 stock assessment model ensemble are shown in Table 1.


The weighted mean across the ensemble is given for these quantities since it is unavailable from the parametric bootstrap.
Based on these findings, the following conservation information is provided:
- Target and limit reference points have not been established for pelagic sharks in the Pacific Ocean. Stock status is reported in relation to MSY-based reference points;
- Median female SSB in 2020 was estimated to be 1.170 of SSBMSY (80th percentile, 0.570 - 1.776) and is likely (63.5% probability) not in an overfished condition relative to MSY-based reference points;
- Recent annual F (F2017-2019) is estimated to be below FMSY and overfishing of the stock is very likely (91.9% probability) not occurring relative to MSY-based reference points; and
- The base case model results show that there is a 61.9% joint probability that NPO BSH stock is not in an overfished condition and that overfishing is not occurring relative to MSY-based reference points.
Conservation Information
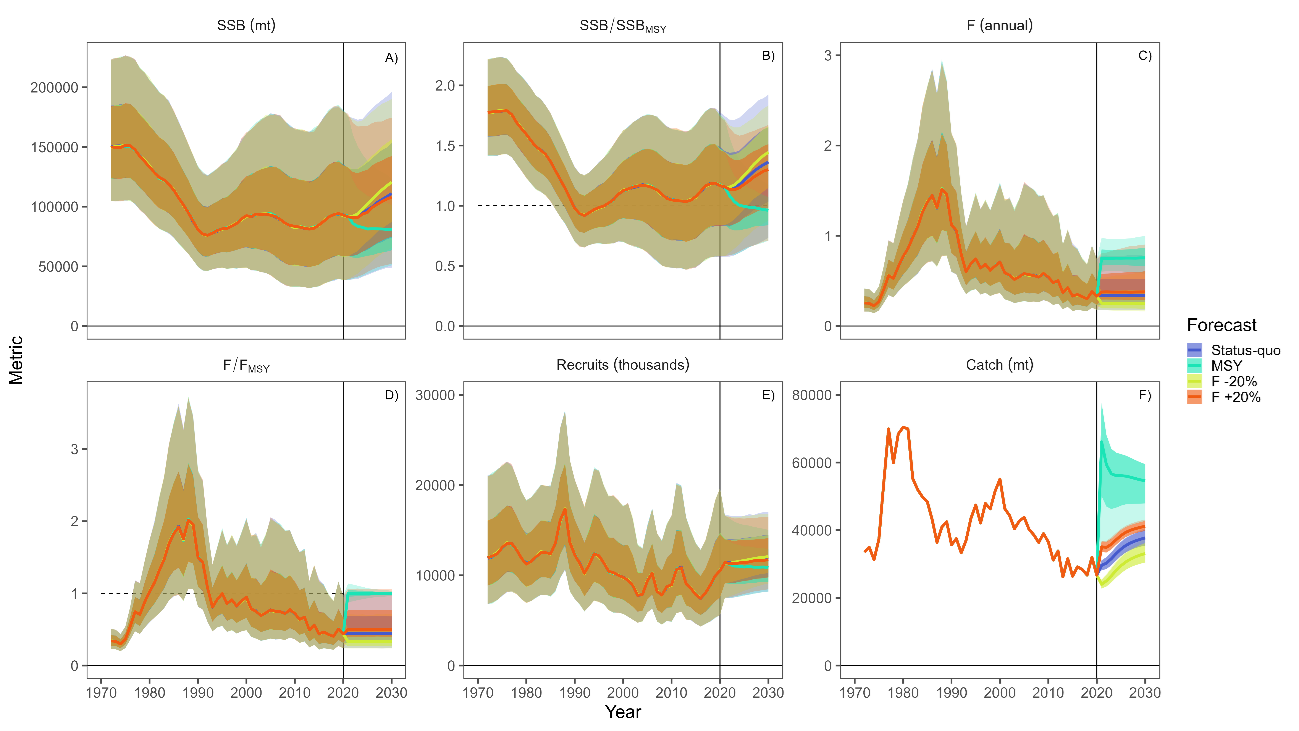
Stock projections of biomass and catch of NPO BSH from 2020 to 2030 were performed assuming four different harvest policies: Fcurrent (2017-2019), FMSY, Fcurrent+20%, and Fcurrent-20% and evaluated relative to MSY-based reference points. Projected SSB trajectories for the alternative management scenarios are shown in Table 2 and Figure 3.


Based on these findings, the following conservation information is provided:
- Future projections in three of the four harvest scenarios (Fcurrent (2017-2019), Fcurrent+20%, and Fcurrent-20%) showed that median BSH SSB in the NPO will likely increase; the FMSY harvest scenario led to a decrease in median SSB;
- Median estimated SSB of BSH in the North Pacific Ocean will likely (> 50 probability) remain above SSBMSY in the next ten years for all scenarios except FMSY; harvesting at FMSY decreases SSB below SSBMSY (Figure 3); and
- There remain some uncertainties in the time series based on the quality (observer vs. logbook) and timespans of catch and relative abundance indices, limited size composition data for several fisheries, the potential for additional catch not accounted for in the assessment, and uncertainty regarding life history parameters. Continued improvements in the monitoring of BSH catches, including recording the size and sex of sharks retained and discarded for all fisheries, as well as continued research into the biology, ecology, and spatial structure of BSH in the North Pacific Ocean are recommended.
The Plenary noted that the average annual catch of BSH by ISC members in 2017-2019 was 24,090 t. Catches in 2020 and 2021 were 23,816 t and 17,078 t, respectively, lower than the three-year average. As ISC member countries account for at least 90% of the overall catch, these figures are believed to provide a reliable estimator of catch in North Pacific BSH.
Special note
The decision to adopt an ensemble modeling approach instead of a single base-case modeling approach was made late in the assessment model development process when it became apparent that there was no clear best base-case model. A consensus on adopting a model ensemble approach was reached and the SHARKWG showed flexibility in adapting to the challenges imposed by the late change on its identification, understanding, development, and discussion of appropriateness of the candidate models. Although timelines can be adjusted to give more opportunity for discussion of key model developments, the SHARKWG should maintain the flexibility shown in the current assessment to adapt to unforeseen aspects of model development.
The SHARKWG notes that uncertainty in stock status in the current assessment is likely still underrepresented as the model ensemble did not consider key uncertainties such as natural mortality or stock-recruitment resilience which are not well-known for many shark species. In the future the SHARKWG will ensure that the model ensemble is informed by the sensitivity analyses