Stock Status and Conservation Information
(From ISC21 Plenary Report)
Pacific Blue Marlin
Based on the stock assessment results, the Plenary adopted the following stock status and conservation advice for Pacific BUM.
![]() Click here to see the ISC20 stock status and conservation information.
Click here to see the ISC20 stock status and conservation information.
Stock Status
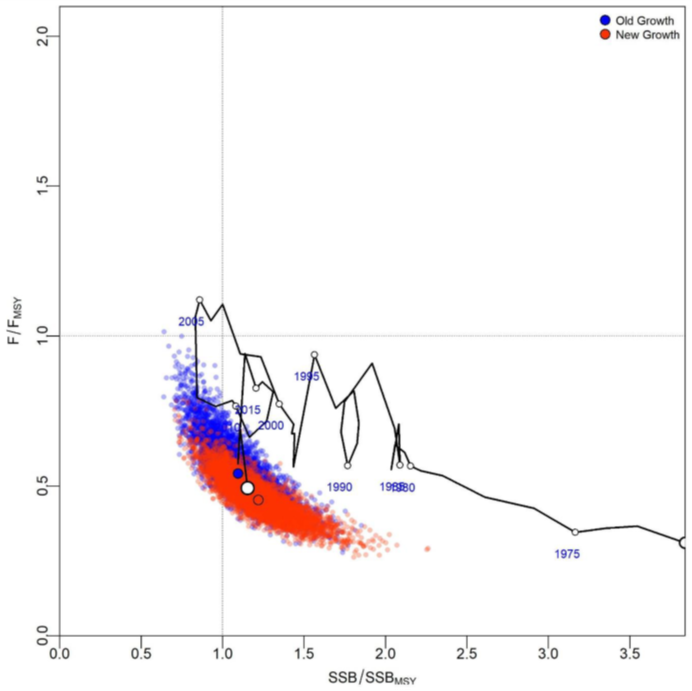
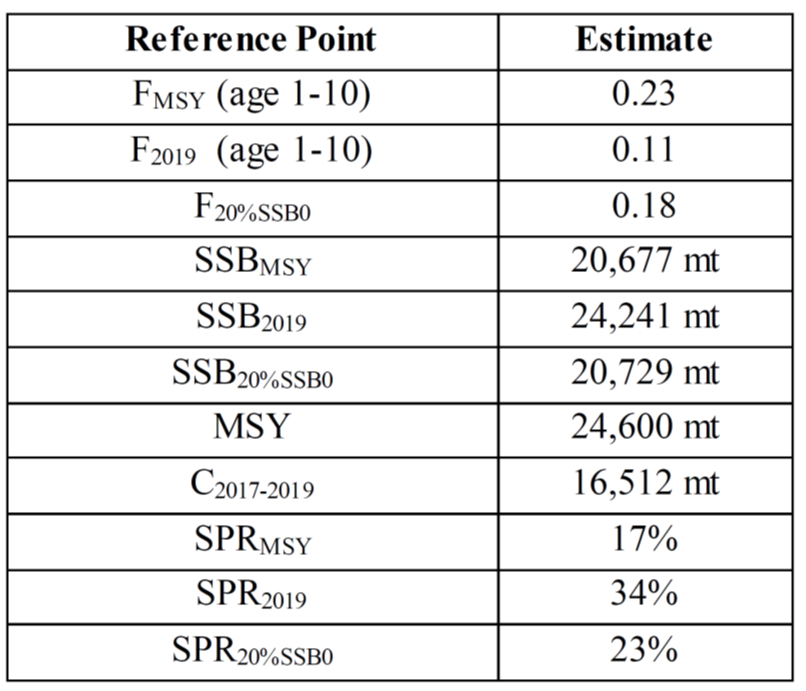
Stock status, biomass trends, and recruitment of Pacific blue marlin (Makaira nigricans) for both models in the ensemble had similar trends, although the estimates of initial conditions are different. All reported results are the model-averaged estimates from the ensemble model unless otherwise noted. Estimates of population biomass declined until the mid-2000s, increased again until 2021, and has been relatively flat until the present. The minimum spawning stock biomass is estimated to be 17,592 mt in 2006 (5% above SSBMSY, the spawning stock biomass to produce MSY, 95% C.I. 14,512-20,703 mt, SSB/SSMSY 95% C.I. 0.70-1.01, Figure 3). In 2019, SSB = 24,272 mt and the relative SSB/SSBMSY = 1.17 (95% C.I. 0.87-1.51). Combined median fishing mortality on the stock (average F on ages 1-10) is currently below FMSY (Figure 3). It averaged roughly F = 0.13 during 2017-2019, or 40% below FMSY, and in 2019, F=0.11 with a relative fishing mortality of F/FMSY = 0.50 (95% C.I. 0.37-0.69). Median fishing mortality has been below FMSY every year except 2003 to 2006. The predicted value of the spawning potential ratio (SPR, the predicted spawning output at current F as a fraction of unfished spawning output) is currently SPR2017-2019 = 31% for the combined model, which is above the SPR required to produce MSY (17%). Recruitment was relatively consistent throughout the assessment time period, with occasional pulses in recruitment, but no notable periods of below-average recruitment (Figure 3). No target or limit reference points have been established for Pacific BUM under the auspices of the WCPFC. Blue marlin is expected to be highly productive due to its rapid growth and high resilience to reductions in spawning potential. Although fishing mortality has approached MSY and exceeded MSY from 2003 to 2006, the biomass of the stock has remained above MSY (Figure 4). With continued decreases in Pacific BUM catch and fishing effort, the stock is expected to remain within MSY limits. When the status of BUM is evaluated relative to MSY-based reference points, the 2019 spawning stock biomass of 24,272 mt is 17% above SSBMSY (20,677 mt, 95% C.I. -13% to +50%) and the 2017-2019 fishing mortality is 50% below FMSY (95% C.I. 37% to 69%) (Table 2).
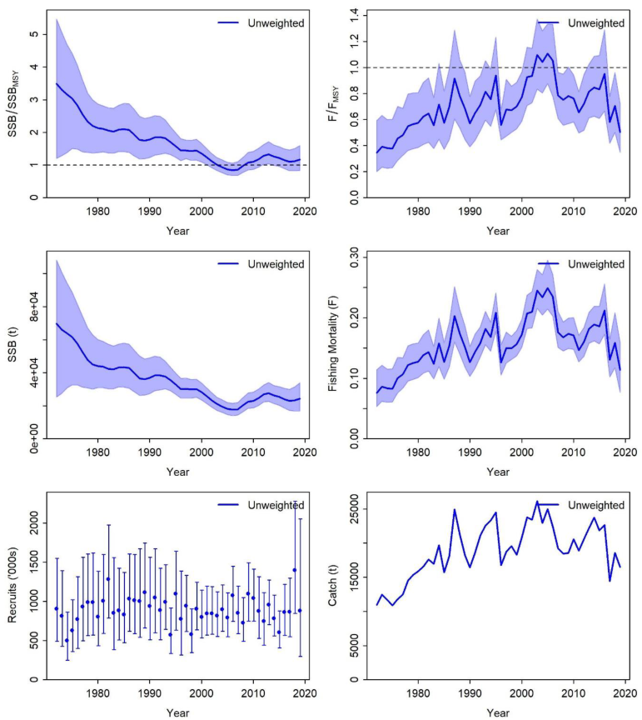

Based on these findings, the following information on the status of the WCNPO Blue Marlin stock is provided:
- No target or limit reference points have been established for Pacific blue marlin by the WCPFC;
- Female spawning stock biomass was estimated to be 24,241 mt in 2019, or about 17% above SSBMSY and 17% above 20%SSB0.
- Fishing mortality on the stock (average F, ages 1 to 10) averaged roughly F = 0.13 during 2016-2019, or about 40% below FMSY and 28% below F20%SSB0.
- Blue marlin stock status from the ensemble model indicates that relative to MSY-based reference points, overfishing was very likely not occurring (>90% probability) and Pacific blue marlin is likely not overfished (81% probability, Figure 4).
Conservation Information
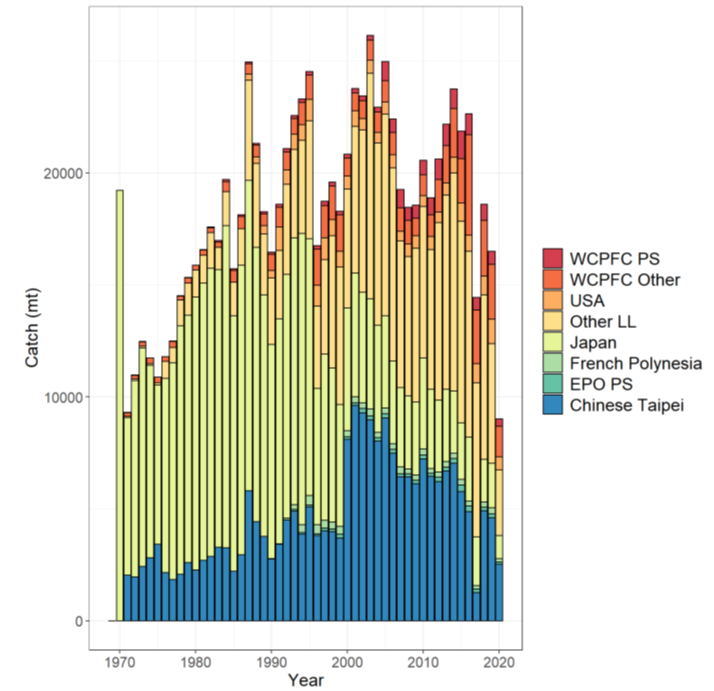
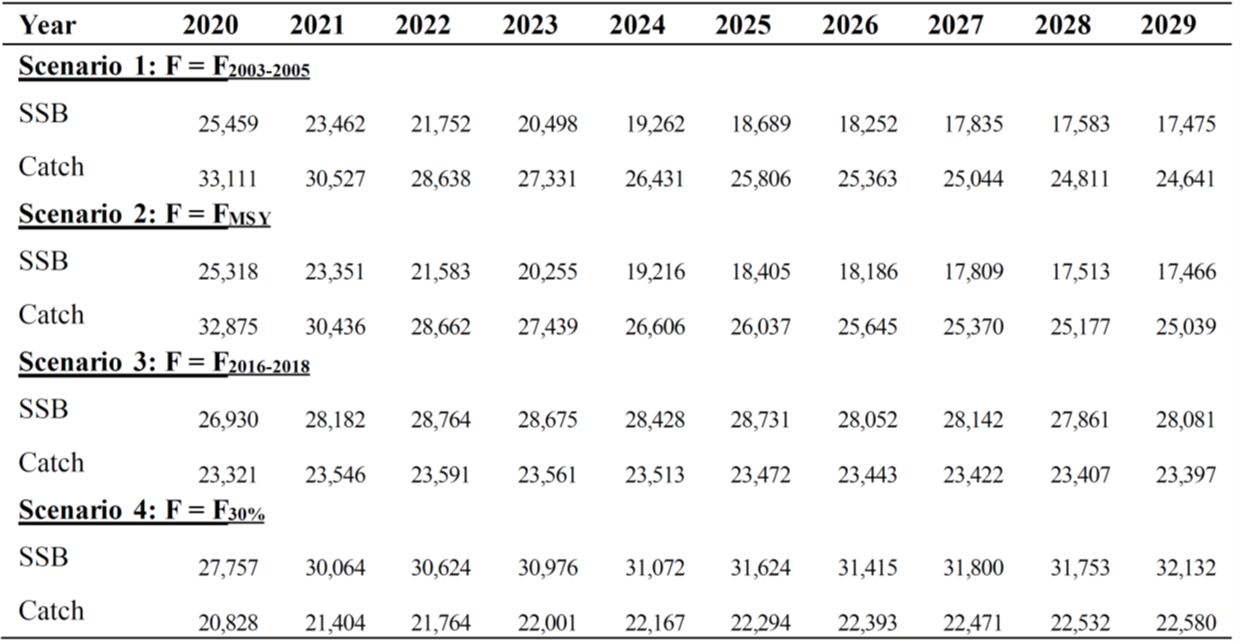
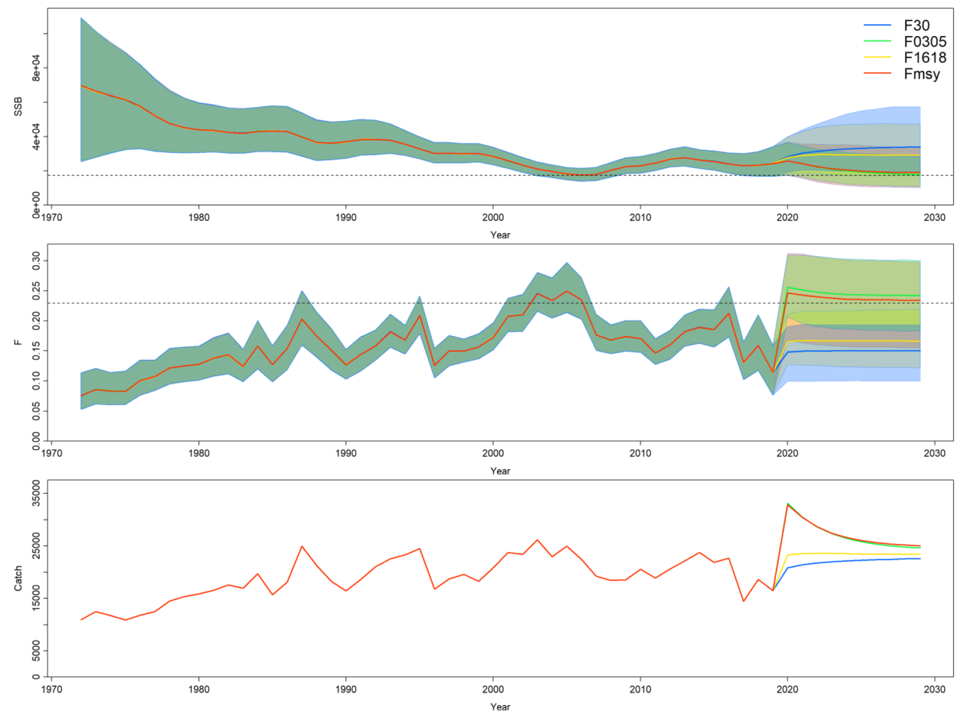
The Pacific blue marlin stock has produced annual yields of around 18,800 mt per year since 2015, or about 90% of the MSY catch. Blue marlin stock status from the ensemble model indicates that the current median spawning biomass is above SSBMSY and that the current median fishing mortality is below FMSY. However, uncertainty in the stock status indicates a 19% chance of Pacific blue marlin being overfished relative to SSBMSY. Both the old and new growth models show evidence of spawning biomass being above SSBMSY and fishing mortality being below FMSY during the last 5 years. Catch biomass has been declining for the last 5 years, and therefore the stock has a low risk of experiencing overfishing or being overfished unless fishing mortality increases to above FMSY based upon stock projections (Table 3, Figure 5). However, it is also important to note that retrospective analyses show that the assessment model tends to overestimate biomass and underestimate fishing mortality in recent years, in part due to rapid changes in longline CPUE.
Based on these findings, the following conservation information is provided:
- There is no evidence of excess fishing mortality above FMSY (F2016-2019 is 40% of FMSY) or substantial depletion of spawning potential (SSB2019 is 17% above SSBMSY);
- It is important to note that retrospective analyses show that the assessment model appears to overestimate spawning stock biomass in recent years; and
- The results show that projected female spawning biomass is expected to increase under the Fstatus quo and F30% harvest scenarios and decline to SSBMSY under the High F and FMSY harvest scenarios. The probability that the stock is overfished or overfishing occurring by 2029 under each harvest scenario is low.
Special Comments
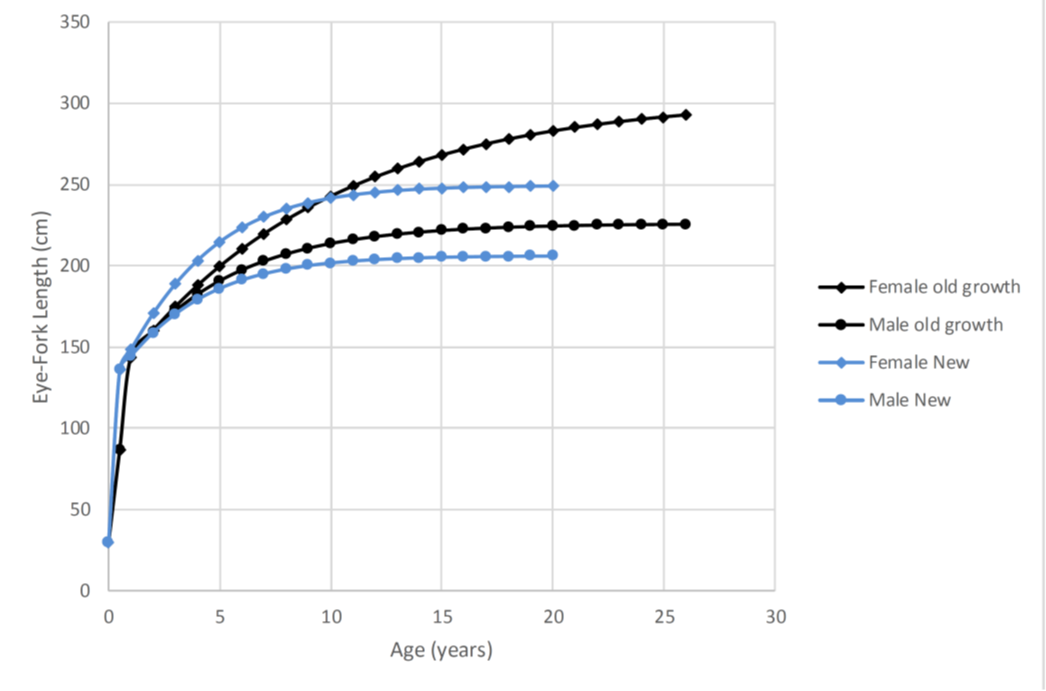
- Uncertainty regarding the choice of BUM growth curve led to the ensemble model approach for this assessment. The BILLWG recognized that there is considerable uncertainty in input CPUE data in the recent years and life history parameters, especially growth. The BILLWG considered an extensive suite of model formulations and associated diagnostics for developing the assessment models. Overall, the BILLWG found issues with both the new growth and old growth model diagnostics and sensitivity runs that are consistent with the presence of data conflicts, but none of the model diagnostics show that the results of either model were invalid. It is recommended model development work to reduce data conflicts and modeling uncertainties continue and that input assessment data be reevaluated to improve the time series.
- It is recommended that biological sampling to improve life history parameter estimates continue to be collected and ISC countries participate in the BILLWG International Biological Sampling program to improve those estimates.