Stock Status and Conservation Information
(From ISC20 Plenary Report)
- Albacore
- Pacific Bluefin
- Blue Marlin
- Striped Marlin
- Swordfish
- Blue shark
- Shortfin mako
Pacific Bluefin Tuna
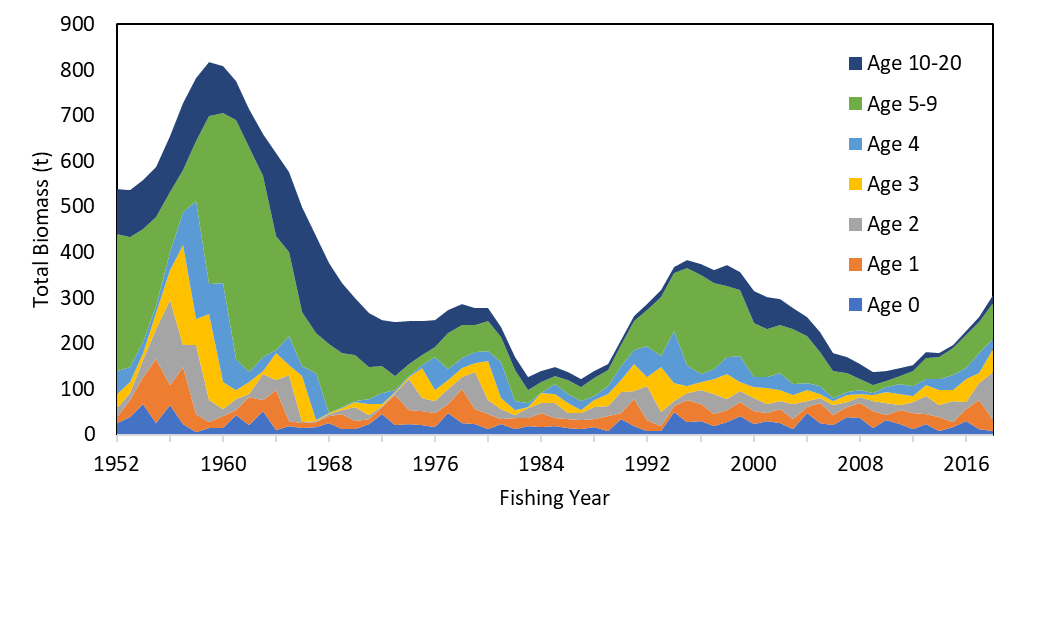
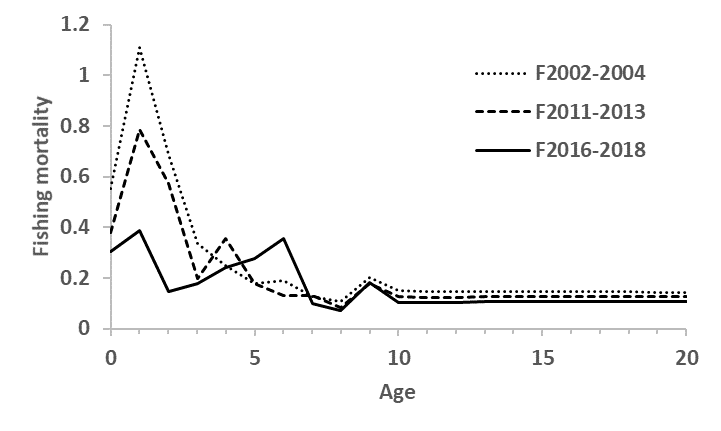
The base-case model results show that: (1) spawning stock biomass (SSB) fluctuated throughout the assessment period (fishing years 1952-2018); (2) the SSB steadily declined from 1996 to 2010; (3) there has been a slow increase of the stock biomass continues since 2011; (4) total biomass in 2018 exceeded the historical median with an increase in immature fish; and (5) fishing mortality (F%SPR) declined from a level producing about 1% of in 2004-2009 to a level producing 14% of SPR in 2016- 2018 (Table 1, Figure 1). Based on the model diagnostics, the estimated biomass trend for the last 30 years is considered robust although SSB prior to the 1980s is uncertain due to data limitations. The SSB in 2018 was estimated to be around 28,000 t (Table 1, Figure 1), which is a 3,000 t increase from 2016 according to the base-case model. An increase of young fish (0-2 years old) was observed in 2016-2018 (Figure 2), likely resulting from low fishing mortality on those fish (Figure 3) and is expected to accelerate the recovery of SSB in the future.
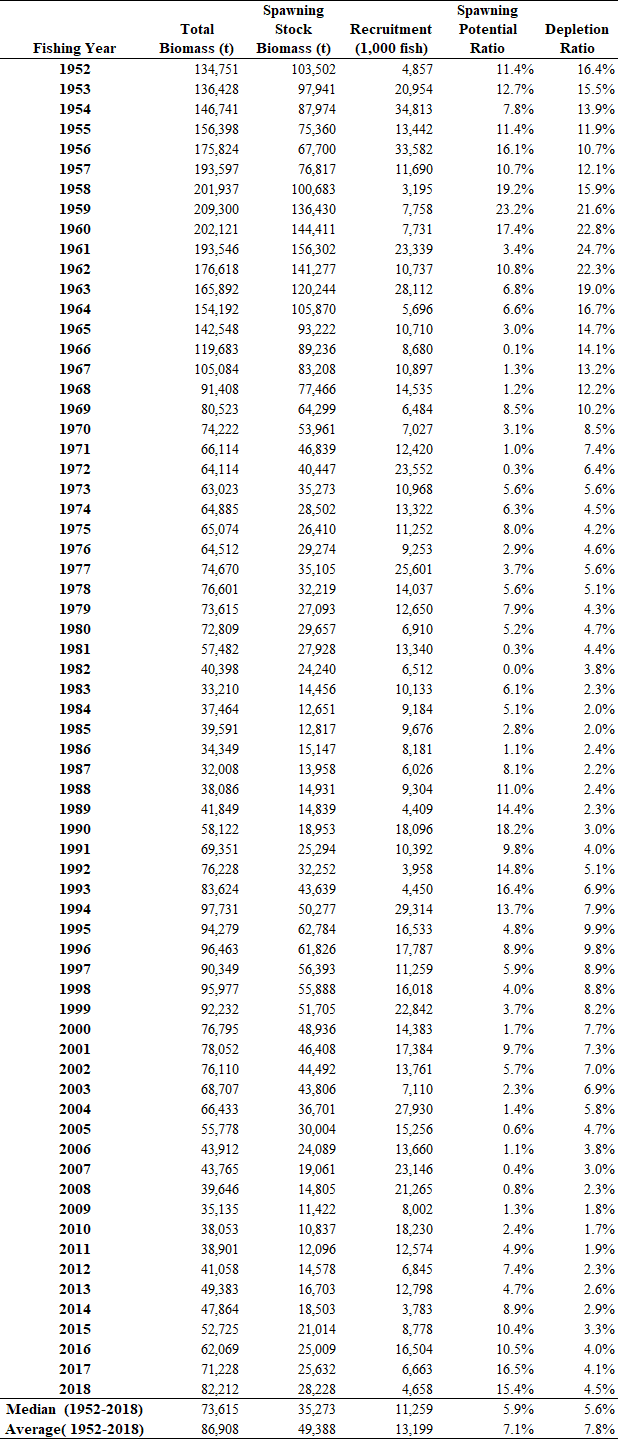
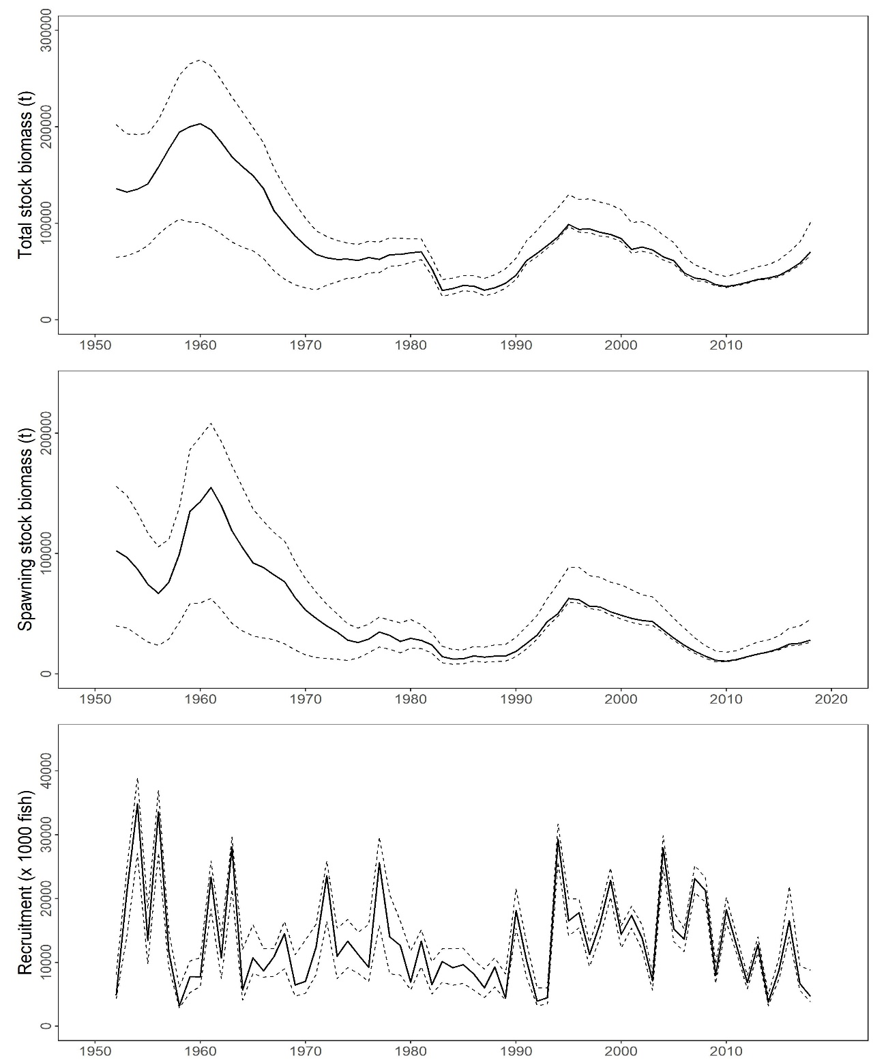
Historical recruitment estimates have fluctuated since 1952 without an apparent trend. Relatively low recruitment levels estimated in 2010-2014 were of concern in the 2016 assessment. The 2015 recruitment estimate is lower than the historical average while the 2016 recruitment estimate (about 17 million fish) is higher than the historical average (Table 1, Figure 1). The recruitment estimates for 2017 and 2018, which are based on fewer observations and more uncertain, are below the historical average.
Estimated age-specific fishing mortalities (F) on the stock during the periods of 2011-2013 and 2016-2018 compared with 2002-2004 estimates (the reference period for the WCPFC Conservation and Management Measure (CMM)) are presented in Figure 3. A substantial decrease in estimated F is observed in ages 0-2 in 2016-2018 relative to the previous years. Note that stricter management measures in the WCPFC and IATTC have been in place since 2015.
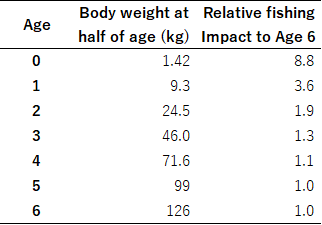
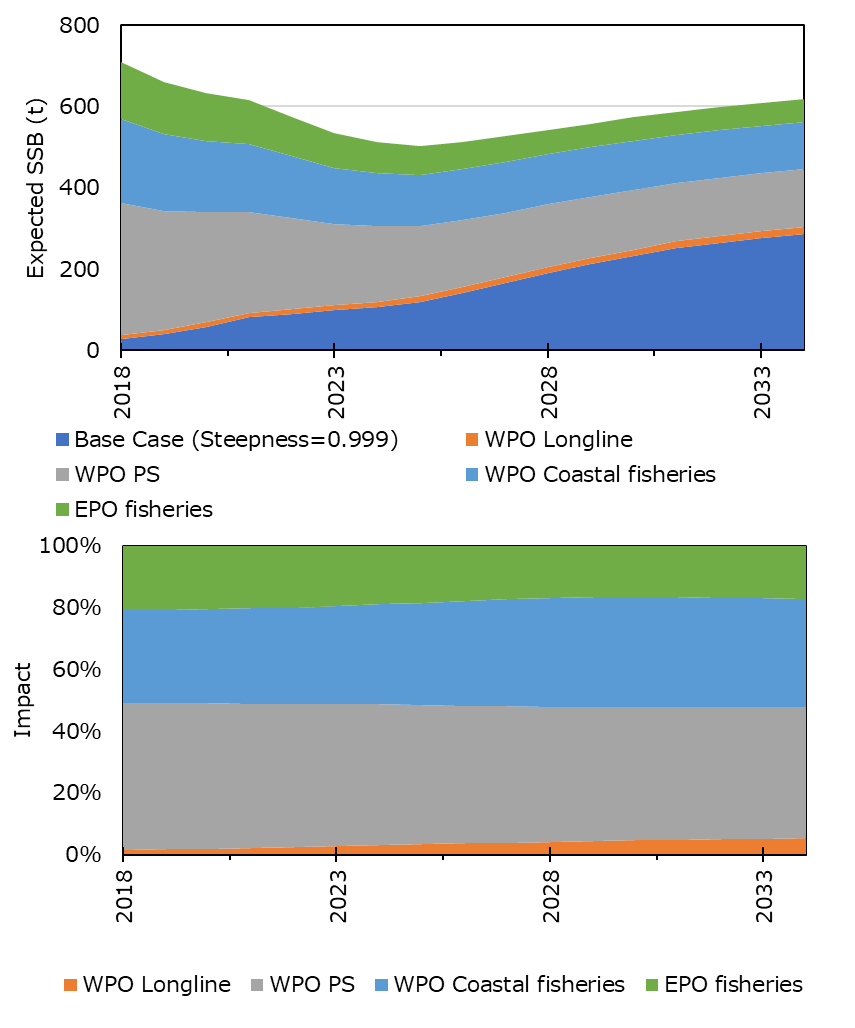
Figure 4 depicts the historical impacts of the fleets on the PBF stock, showing the estimated biomass when fishing mortality from the respective fleets is zero. Historically, the WPO coastal fisheries have had the greatest impact on the PBF stock, but since about the early 1990s the WPO purse seine fishery targeting small fish (ages 0-1) has had a greater impact and the effect in 2018 was greater than any of the other fishery. The impact of the EPO fisheries was large before the mid-1980s, decreasing significantly thereafter. The WPO longline fisheries has had a limited effect on the stock throughout the analysis period because the impact of a fishery on a stock depends on both the number and size of the fish caught by each fleet; i.e., catching a high number of smaller juvenile fish can have a greater impact on future spawning stock biomass than catching the same weight of larger mature fish (see the conversion factors in Table 2). There is greater uncertainty regarding discards than other fishery impacts because the impact of discarding is not based on observed data.
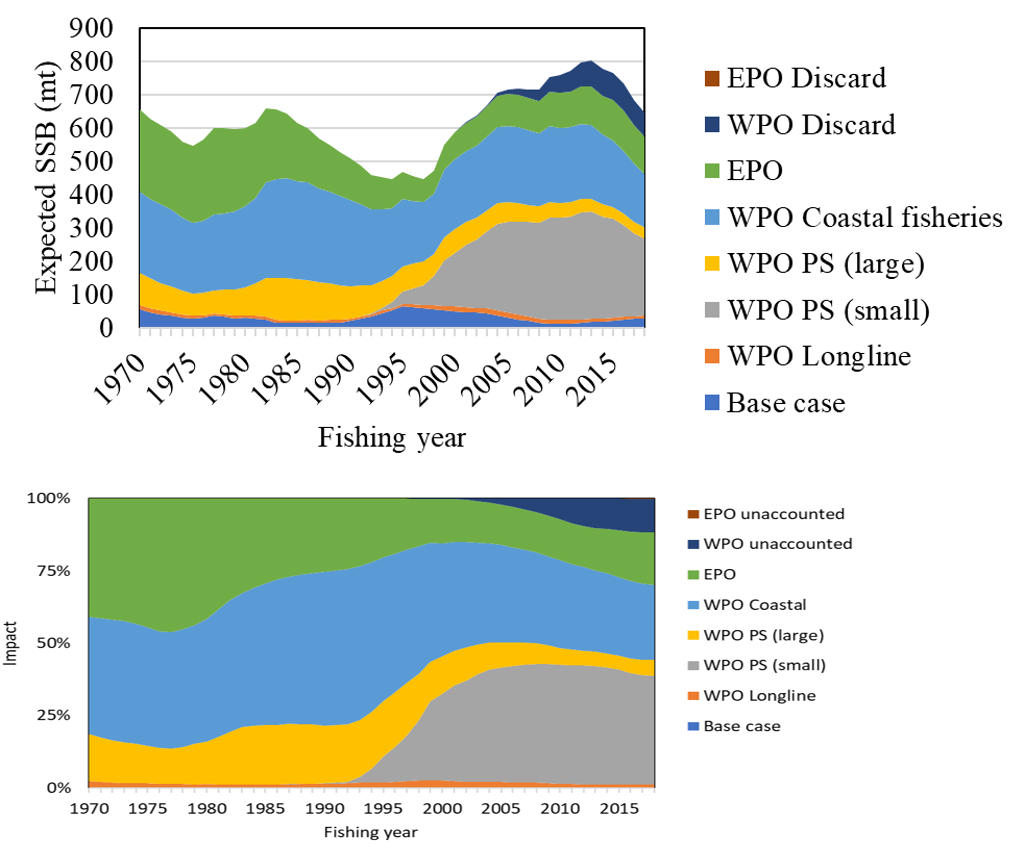
- WPO longline: F1, F12, F17, F23.
- WPO purse seine for small fish: F2, F3, F18, F20.
- WPO purse seine for large fish: F4, F5.
- WPO coastal fisheries: F6-11, F16, F19.
- EPO fisheries: F13, F14, F15, F24.
- WPO unaccounted fisheries: F21, F22.
- EPO unaccounted fisheries: F25.
Stock Status
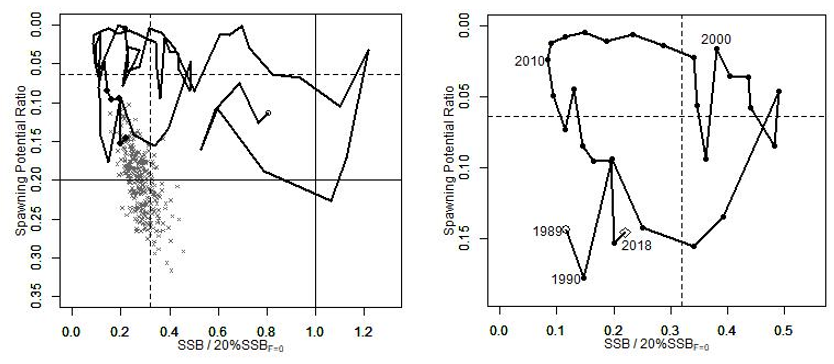
The WCPFC and IATTC adopted an initial rebuilding biomass target (the median SSB estimated for the period from 1952 through 2014) and a second rebuilding biomass target (20%SSBF=0 under average recruitment), without specifying a fishing mortality reference level. The 2020 assessment estimated the initial rebuilding biomass target (SSBMED1952-2014) to be 6.4%SSBF=0 and the corresponding fishing mortality expressed as F6.4%SPR. The Kobe plot shows that the point estimate of the SSB2018 was 4.5%SSBF=0 and the recent (2016-2018) fishing mortality corresponds to F14%SPR (Table 1, Figure 5). Although no reference points have been adopted to evaluate the status of PBF, an evaluation of stock status against some common reference points (Table 3) shows that the stock is overfished relative to biomass-based limit reference points adopted for other species in WCPFC (20%SSBF=0) and fishing mortality has declined but not reached the level corresponding to that reference point (F20%SPR).
The PBF spawning stock biomass (SSB) has gradually increased in the last 8 years (2011-2018). Young fish (age 0-2) shows a more rapid increase in recent years (Figure 6, Figure 7). These changes in biomass coincide with a decline in fishing mortality over the last decade (Figure 8). Based on these findings, the following information on the status of the Pacific bluefin tuna stock is provided:
- The latest (2018) SSB is estimated to be 4.5% of SSBF=0, which is an increase from 4.0% estimated for 2016 (Figure 5 and Table 3; the terminal year in the previous assessment). No biomass-based limit or target reference points have been adopted for PBF. However, the PBF stock is overfished relative to the potential biomassbased reference points (SSBMED and 20%SSBF=0) adopted for other tuna species by the IATTC and WCPFC.
- The recent (2016-2018) F%SPR is estimated to produce 14%SPR (Figure 5 and Table 3). Although no fishing mortality-based limit or target reference points have been adopted for PBF by the IATTC and WCPFC, recent fishing mortality is above the level producing 20%SPR. However, the stock is subject to rebuilding measures including catch limits and the capacity of the stock to rebuild is not compromised, as shown by the projection results.
Fmax: Fishing mortality (F) that maximizes equilibrium yield per recruit (Y/R).
F0.1: F at which the slope of the Y/R curve is 10% of the value at its origin.
Fmed: F corresponding to the inverse of the median of the observed R/SSB ratio.
Fxx%SPR: F that produces given % of the unfished spawning potential (biomass) under equilibrium condition.

Conservation Information
After the steady decline in SSB from 1995 to the historically low level in 2010, the PBF stock has started recovering slowly, consistent with the management measures implemented in 2014-2015. The spawning stock biomass in 2018 was below the two biomass rebuilding targets adopted by the WCPFC while the 2016-18 fishing mortality (F%SPR) has reduced to a level producing 14%SPR.
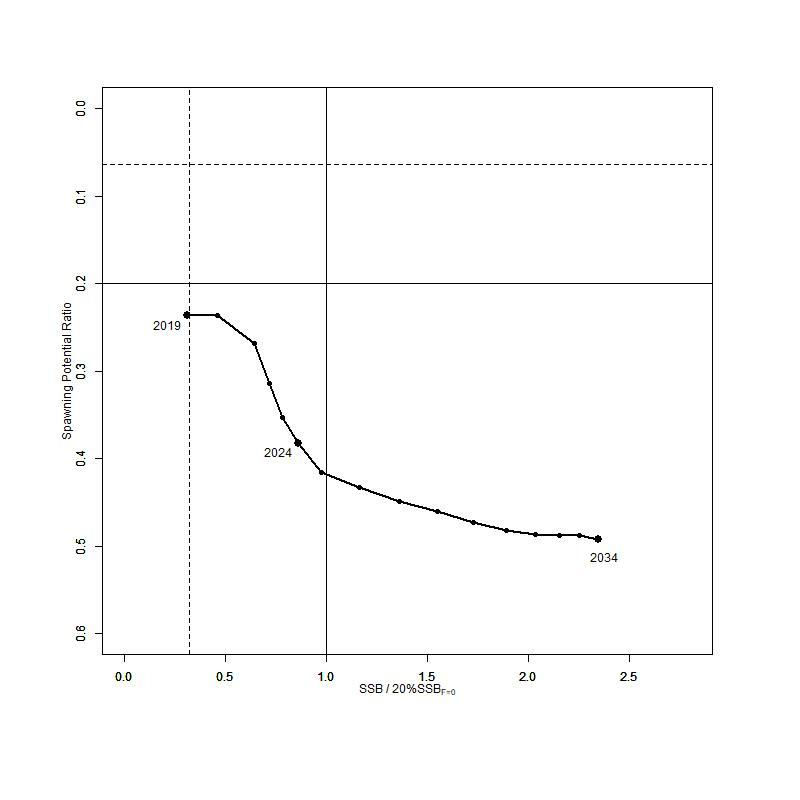
The projection results based on the base-case model under several harvest and recruitment scenarios and time schedules requested by the RFMOs are shown in Table 3 and Table 4 and Figures 6 and 7. The projection results show that PBF SSB recovers to the biomass-based rebuilding targets due to reduced fishing mortality by applying catch limits as the stock increases (Figure 6). In most of the scenarios, the SSB biomass is projected to recover to the initial rebuilding target (SSBMED) in the fishing year 2020 (April of 2021) with a probability above the 60% level prescribed in the WCPFC CMM 2019-02 (Table 5).
A Kobe chart and impacts by fleets estimated from future projections under the current management scheme are provided for information (Figures 6 and Figure 7, respectively). Because the projections include catch limits, fishing mortality (Fx%SPR) is expected to decline, i.e., SPR will increase, as biomass increases. Further stratification of future impacts is possible if the allocation of increased catch limits among fleets/countries is specified.
Based on these comments, the following conservation information is provided:
- Under all examined scenarios the initial goal of WCPFC and IATTC, rebuilding to SSBMED by 2024 with at least 60% probability, is reached and the risk of SSB falling below historical lowest observed SSB at least once in 10 years is negligible (Table 4, and Table 5).
- The projection results assume that the CMMs are fully implemented and are based on certain biological and other assumptions. For example, these future projection results do not contain assumptions about discard mortality. Although the impact of discards on SSB is small compared to other fisheries (Figure 4), discards should be considered in the harvest scenarios.
- Given the low SSB, the uncertainty in future recruitment, and the influence recruitment has on stock biomass, monitoring recruitment and SSB should continue so that the recruitment level can be understood in a timely manner.
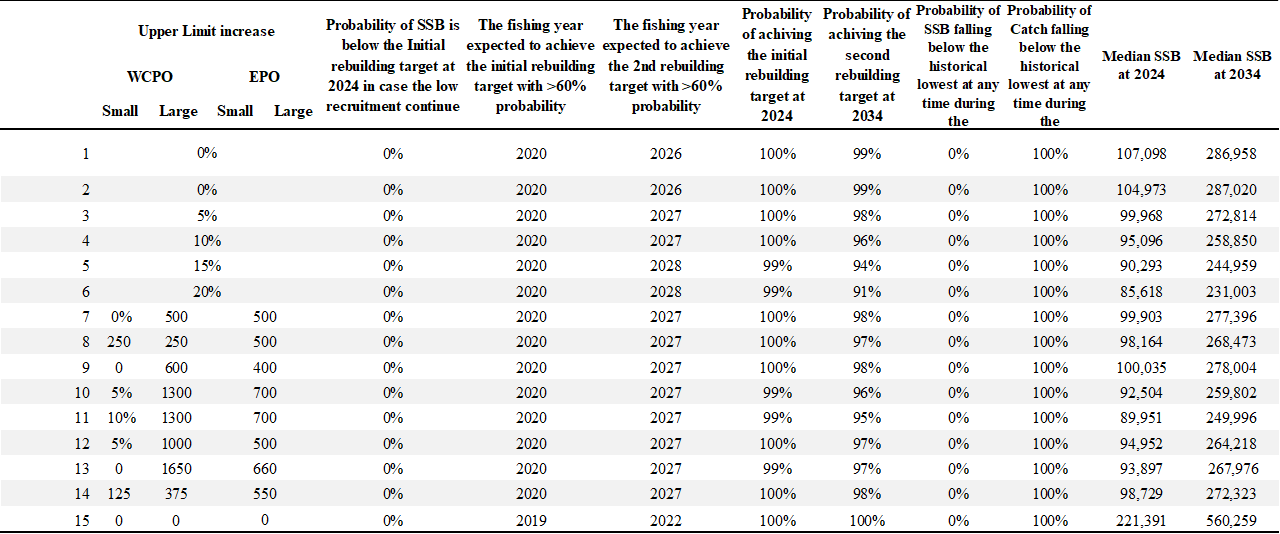
- The numbering of Scenarios is different from those given by the IATTC-WCPFC NC Joint WG meeting and same as Table 3.
- Recruitment is switched from low recruitment during 1980-1989 to average recruitment over the whole assessment period in the following year of achieving the initial rebuilding target.
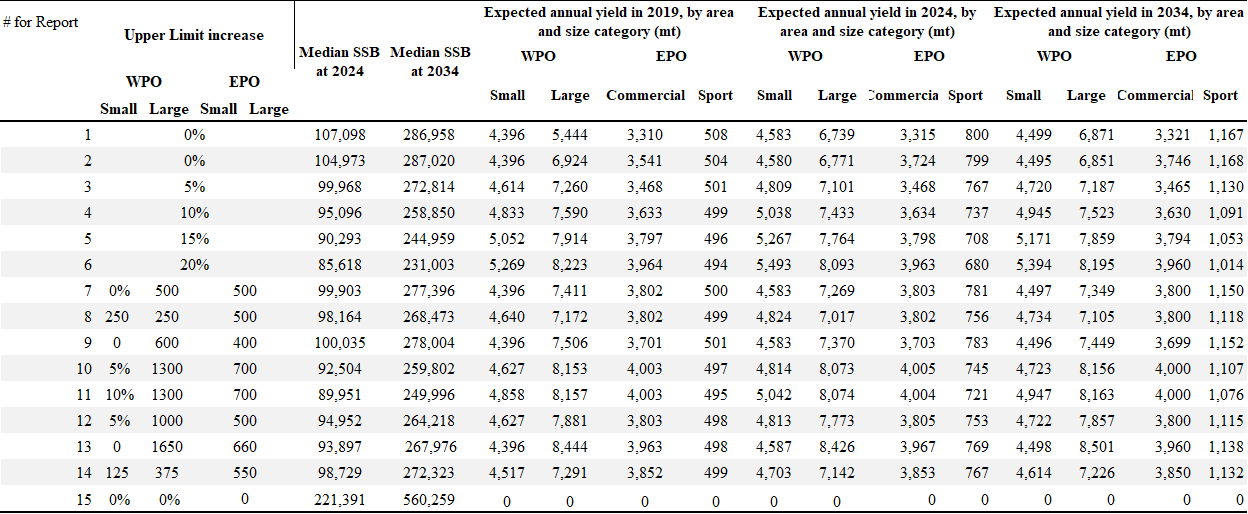
- Catch limits for EPO commercial fisheries are applied for the catch of both small and large fish made by the fleets.


